A version of this article appeared today in the Jakarta Post
Palm oil is one of the world’s most traded and versatile agricultural commodities. It can be used as edible vegetable oil, industrial lubricant, raw material in cosmetic and skincare products and feedstock for biofuel production. Growing global demand for palm oil and the ensuing cropland expansion has been blamed for a wide range of environmental ills, including tropical deforestation, peatland degradation, biodiversity loss and CO2 emissions (Koh & Wilcove 2008; Butler & Laurance 2009; Danielsen et al. 2009). In response to these concerns, a group of stakeholders—including activists, investors, producers and retailers—formed the Roundtable on Sustainable Palm Oil (RSPO; www.rspo.org) to develop a certification scheme for palm oil produced through environmentally- and socially-responsible ways. It is widely anticipated that the creation of a premium market for RSPO-certified sustainable palm oil (CSPO) would incentivize palm oil producers to improve their management practices.
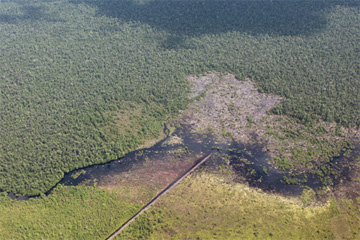 Draining and clearing of peat forest in Central Kalimantan. Photo by Rhett A. Butler. |
However, the RSPO faces several challenges (Laurance et al. 2009), including the high cost of undergoing certification that currently is entirely borne by producers, and a lackluster demand for CSPO. Following the first shipment of CSPO to Europe in November 2008, less than 3% of the total volume of CSPO produced (~1.05 million tons) had been sold (Butler 2009a). Even after a year, in October 2009, only ~200,000 tons of CSPO (~19%) had been purchased by manufacturers of palm oil products (Butler 2009b). The reason for the slow demand for CSPO is unclear, but is likely due to the global financial downturn causing buyers and manufacturers to be less willing to switch to premium palm oil. The economic crisis may have also affected efforts to promote sustainable consumerism in countries, such as China and India, which are the world’s largest importers of palm oil. A further factor could be a lack of consumer confidence in RSPO’s credibility, stoked by activists’ accusations that certification is the industry’s attempt at greenwashing to mislead consumers (Koh et al. 2009). On the other hand, other environmental groups warn that if the RSPO should fail in its endeavor, the palm oil industry will likely revert to business-as-usual practices that will continue to harm the environment (Butler 2009a).
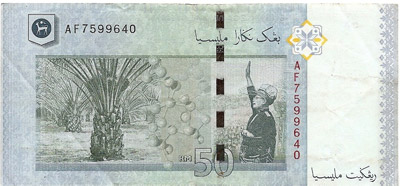 The 50 Malaysian ringgit note features an oil palm. |
Here, we argue that the financial burden and risk of producing sustainable palm oil should not fall solely on producers; instead these costs should be shared among key actors along the palm oil supply chain that includes both traders and buyers. We further argue that at the national level some countries may be more financially capable than others in creating a stronger demand for premium palm oil.
|
Deforested area and healthy forest in Borneo. |
We therefore propose an “ability-to-pay” index that identifies the richest and largest palm oil importing countries as those that are most morally obligated to contribute to developing a successful CSPO market to raise the environmental performance of the palm oil industry. In its simplest formulation, this ability-to-pay index could be a multiplier function of two metrics—a country’s per capita import volume of palm oil and its per capita Gross Domestic Product (GDP). Import is a more appropriate metric to consider than consumption because countries that benefit from importing and re-exporting palm oil (i.e., traders) are also obligated to reduce the environmental impacts of their profiteering activities.
Based on 2007 values of these two metrics (FAO 2009; World Bank 2009), we calculated the ability-to-pay index for 156 countries (Table 1; Appendix S1). The top 10 countries on this list are: the Netherlands, Germany, United States, United Kingdom, Japan, Italy, Belgium, China, France and Spain. The Netherlands justifiably tops the list, being both the second largest importer (1.24 million tons) and the largest exporter (1.25 million tons) of palm oil; and ranks among the richest industrialized nations in the world (per capita GDP: US$46,750). Indeed, six of the “Group of Eight” or G8 nations are represented in this list (i.e., Germany, United States, United Kingdom, Japan, Italy and France). In contrast, although China is the world’s largest importer of palm oil (5.4 million tons), by virtue of it being significantly less affluent (per capita GDP: US$2,575) than other major palm oil importers, it is ranked eighth on our list. China also happens to be the only developing country in this group.
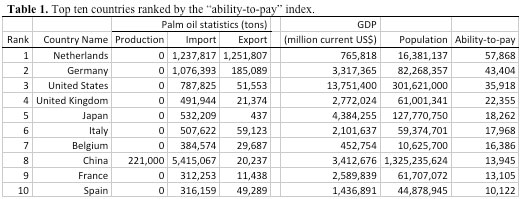 All values are for the year 2007. Values for China include Hong Kong. The ability-to-pay index is calculated as the product of per capita palm oil import and per capita Gross Domestic Product (GDP). For some countries, export volume may be larger than the sum of production and import volume because of cumulative palm oil stocks produced or imported in previous years. Data on palm oil statistics were obtained from the Food and Agriculture Organization of the United Nations (2009), and data on GDP and population were obtained from the World Bank (2009). See Appendix S1 for full list of 156 countries. |
|
What are the financial implications of switching from uncertified to certified palm oil for the country and individual consumer? We based our estimates of the cost of large-scale adoption of CSPO on a palm oil price of US$781/ton (2006-08 average; USDA-FAS 2009) and an estimated 15% price differential between uncertified and certified palm oil (RSPO 2009). We found that Indonesia—the world’s largest palm oil producer—which consumes 4.9 million tons of palm oil annually (2008 values; USDA-FAS 2009), would incur an additional cost of US$571 million by switching from consuming uncertified to certified palm oil; whereas for the United States, which consumes 960,000 tons of palm oil annually (and is experiencing rising palm oil demand), the added cost would be US$112 million. For the individual consumer in Indonesia, he or she would need to spend an additional US$2.50, which represents 0.13% of his or her annual income (per capita GDP); whereas an American consumer would only need to spend an extra US$0.40, equivalent to 0.0008% of his or her yearly income. Thus, an individual in a developing country such as Indonesia not only has to shoulder the cost of producing sustainable palm oil, but he or she would also be much heavily burdened by switching to using sustainable palm oil, compared to a consumer in a richer nation such as the United States.
Given the anticipated growth in global demand for edible vegetable oils and biofuels, a certification scheme could prove to be an attractive financial incentive—a key “pressure point” of the industry (Wilcove & Koh 2009)—for farmers to improve their environmental performance. However, for any certification scheme to be credible and feasible, its financial burden would have to be appropriately shared among different stakeholders. In particular, as suggested by our analysis, the richer buyers and traders of palm oil have a moral obligation to ensure the success of certification.
Rhett Butler is founder of mongabay.com, an environmental science news website with a focus on tropical forests. Dr. Lian Pin Koh is a research fellow at the science and technology university ETH Zurich in Switzerland.
Supporting Information
Appendix S1. Summary statistics used in the calculation of the “ability-to-pay” index for 156 countries engaged in the production, import and export of palm oil. All values are for the year 2007. Values for China include Hong Kong. The ability-to-pay index is calculated as the product of per capita palm oil import and per capita Gross Domestic Product (GDP). For some countries, export volume may be larger than the sum of production and import volume because of cumulative palm oil stocks produced or imported in previous years. Data on palm oil statistics were obtained from the Food and Agriculture Organization of the United Nations (2009), and data on GDP and population were obtained from the World Bank (2009).
| Palm oil statistics (tons) | GDP | ||||||
| Rank | Country Name | Production | Import | Export | (million current US$) | Population | Ability-to-pay |
| 1 | Netherlands | 0 | 1,237,817 | 1,251,807 | 765,818 | 16,381,137 | 57,868 |
| 2 | Germany | 0 | 1,076,393 | 185,089 | 3,317,365 | 82,268,357 | 43,404 |
| 3 | United States | 0 | 787,825 | 51,553 | 13,751,400 | 301,621,000 | 35,918 |
| 4 | United Kingdom | 0 | 491,944 | 21,374 | 2,772,024 | 61,001,341 | 22,355 |
| 5 | Japan | 0 | 532,209 | 437 | 4,384,255 | 127,770,750 | 18,262 |
| 6 | Italy | 0 | 507,622 | 59,123 | 2,101,637 | 59,374,701 | 17,968 |
| 7 | Belgium | 0 | 384,574 | 29,687 | 452,754 | 10,625,700 | 16,386 |
| 8 | China | 221,000 | 5,415,067 | 20,237 | 3,412,676 | 1,325,235,624 | 13,945 |
| 9 | France | 0 | 312,253 | 11,438 | 2,589,839 | 61,707,072 | 13,105 |
| 10 | Spain | 0 | 316,159 | 49,289 | 1,436,891 | 44,878,945 | 10,122 |
| 11 | Denmark | 0 | 168,846 | 21,122 | 311,580 | 5,461,438 | 9,633 |
| 12 | Sweden | 0 | 133,524 | 24,298 | 454,310 | 9,148,092 | 6,631 |
| 13 | Russia | 0 | 575,605 | 750 | 1,290,082 | 142,100,000 | 5,226 |
| 14 | Australia | 0 | 128,335 | 87 | 820,974 | 21,015,000 | 5,014 |
| 15 | Saudi Arabia | 0 | 280,426 | 4,990 | 381,683 | 24,157,431 | 4,431 |
| 16 | Korea | 0 | 187,564 | 39 | 969,795 | 48,456,000 | 3,754 |
| 17 | India | 0 | 3,514,900 | 805 | 1,176,890 | 1,124,786,997 | 3,678 |
| 18 | Turkey | 0 | 365,629 | 6 | 655,881 | 73,885,055 | 3,246 |
| 19 | Malaysia | 15,823,200 | 435,845 | 13,011,131 | 186,719 | 26,549,518 | 3,065 |
| 20 | Ireland | 0 | 51,024 | 1,789 | 259,018 | 4,366,193 | 3,027 |
| 21 | Singapore | 0 | 85,443 | 175,789 | 161,347 | 4,588,600 | 3,004 |
| 22 | Mexico | 57,000 | 302,411 | 636 | 1,022,815 | 105,280,515 | 2,938 |
| 23 | Greece | 0 | 81,381 | 13,691 | 313,354 | 11,193,366 | 2,278 |
| 24 | Austria | 0 | 48,236 | 613 | 373,192 | 8,315,427 | 2,165 |
| 25 | Poland | 0 | 164,547 | 167 | 422,090 | 38,120,560 | 1,822 |
| 26 | Iran | 0 | 448,057 | 929 | 286,058 | 71,021,039 | 1,805 |
| 27 | South Africa | 0 | 299,092 | 1,001 | 283,007 | 47,850,700 | 1,769 |
| 28 | Switzerland | 0 | 28,248 | 15 | 424,367 | 7,550,077 | 1,588 |
| 29 | Pakistan | 0 | 1,710,437 | 0 | 142,893 | 162,481,399 | 1,504 |
| 30 | Ukraine | 0 | 476,809 | 155,967 | 141,177 | 46,509,350 | 1,447 |
| 31 | Norway | 0 | 15,672 | 17 | 388,413 | 4,709,153 | 1,293 |
| 32 | Canada | 0 | 28,905 | 882 | 1,329,885 | 32,976,000 | 1,166 |
| 33 | Namibia | 0 | 305,845 | 2 | 7,015 | 2,080,083 | 1,031 |
| 34 | Kuwait | 0 | 23,156 | 0 | 112,116 | 2,662,966 | 975 |
| 35 | Portugal | 0 | 41,116 | 109 | 222,758 | 10,608,335 | 863 |
| 36 | Bangladesh | 0 | 1,728,006 | 744 | 68,415 | 158,571,814 | 746 |
| 37 | New Zealand | 0 | 21,958 | 8 | 135,667 | 4,228,300 | 705 |
| 38 | Brazil | 190,000 | 98,607 | 2,403 | 1,313,361 | 191,601,284 | 676 |
| 39 | Israel | 0 | 24,563 | 56 | 163,957 | 7,180,100 | 561 |
| 40 | Sri Lanka | 0 | 332,855 | 9,064 | 32,346 | 20,010,000 | 538 |
| 41 | Finland | 0 | 10,455 | 14 | 244,661 | 5,288,720 | 484 |
| 42 | Czech Republic | 0 | 27,195 | 542 | 174,998 | 10,334,160 | 461 |
| 43 | Egypt | 0 | 260,667 | 444 | 130,476 | 75,466,539 | 451 |
| 44 | Venezuela, RB | 70,000 | 53,385 | 15 | 228,071 | 27,483,000 | 443 |
| 45 | Romania | 0 | 51,769 | 1 | 165,976 | 21,546,873 | 399 |
| 46 | Vietnam | 0 | 457,616 | 6,187 | 68,643 | 85,154,900 | 369 |
| 47 | Philippines | 62,000 | 185,400 | 8,188 | 144,062 | 87,892,094 | 304 |
| 48 | Algeria | 0 | 73,474 | 0 | 135,285 | 33,852,676 | 294 |
| 49 | Kenya | 0 | 415,970 | 34,565 | 24,190 | 37,530,726 | 268 |
| 50 | Angola | 55,000 | 64,100 | 12,000 | 61,403 | 16,948,673 | 232 |
| 51 | El Salvador | 0 | 73,711 | 2,387 | 20,373 | 6,853,143 | 219 |
| 52 | Tunisia | 0 | 60,289 | 55 | 35,020 | 10,225,400 | 206 |
| 53 | Hungary | 0 | 14,577 | 0 | 138,429 | 10,055,579 | 201 |
| 54 | Benin | 40,000 | 291,500 | 236 | 5,428 | 9,025,402 | 175 |
| 55 | Croatia | 0 | 14,679 | 226 | 51,278 | 4,435,982 | 170 |
| 56 | Yemen | 0 | 149,743 | 746 | 22,523 | 22,383,108 | 151 |
| 57 | Syria | 0 | 69,893 | 0 | 37,745 | 19,890,585 | 133 |
| 58 | Tanzania | 6,200 | 323,226 | 16,341 | 16,181 | 40,432,163 | 129 |
| 59 | Lithuania | 0 | 11,226 | 525 | 38,332 | 3,375,618 | 127 |
| 60 | Jordan | 0 | 42,509 | 2,876 | 15,833 | 5,718,855 | 118 |
| 61 | Sudan | 0 | 92,900 | 0 | 46,228 | 38,555,569 | 111 |
| 62 | Trinidad & Tobago | 0 | 6,747 | 0 | 20,886 | 1,333,050 | 106 |
| 63 | Azerbaijan | 0 | 28,806 | 0 | 31,248 | 8,556,379 | 105 |
| 64 | Bulgaria | 0 | 19,928 | 2,147 | 39,549 | 7,659,764 | 103 |
| 65 | Lebanon | 0 | 17,080 | 315 | 24,352 | 4,097,076 | 102 |
| 66 | Ghana | 109,000 | 150,900 | 92,000 | 15,147 | 23,461,523 | 97 |
| 67 | Peru | 34,000 | 24,031 | 745 | 107,297 | 27,898,182 | 92 |
| 68 | Slovak Republic | 0 | 5,846 | 3 | 74,972 | 5,397,318 | 81 |
| 69 | Djibouti | 0 | 76,663 | 1,124 | 830 | 832,992 | 76 |
| 70 | Kazakhstan | 0 | 11,001 | 1 | 104,853 | 15,484,200 | 74 |
| 71 | Serbia | 0 | 12,961 | 57 | 40,122 | 7,381,579 | 70 |
| 72 | Colombia | 780,000 | 14,617 | 315,575 | 207,786 | 43,987,000 | 69 |
| 73 | Congo | 25,000 | 31,559 | 30 | 7,646 | 3,766,751 | 64 |
| 74 | Guatemala | 130,000 | 24,754 | 110,186 | 33,855 | 13,348,222 | 63 |
| 75 | Uganda | 0 | 143,703 | 19,586 | 11,771 | 30,916,072 | 55 |
| 76 | Chile | 0 | 5,512 | 4 | 163,913 | 16,594,596 | 54 |
| 77 | Dominican Republic | 32,000 | 13,132 | 0 | 36,686 | 9,725,569 | 50 |
| 78 | Slovenia | 0 | 2,005 | 36 | 47,182 | 2,018,122 | 47 |
| 79 | Mauritius | 0 | 8,326 | 0 | 6,786 | 1,260,692 | 45 |
| 80 | Mauritania | 0 | 52,308 | 0 | 2,644 | 3,120,981 | 44 |
| 81 | Morocco | 0 | 17,440 | 341 | 75,119 | 30,860,595 | 42 |
| 82 | Bermuda | 0 | 441 | 0 | 5,855 | 64,000 | 40 |
| 83 | Haiti | 0 | 53,757 | 0 | 6,715 | 9,611,554 | 38 |
| 84 | Uruguay | 0 | 4,884 | 163 | 23,136 | 3,323,906 | 34 |
| 85 | Nicaragua | 8,800 | 32,102 | 1,092 | 5,726 | 5,604,596 | 33 |
| 86 | Senegal | 6,100 | 34,885 | 1,459 | 11,165 | 12,411,094 | 31 |
| 87 | Cameroon | 172,000 | 27,355 | 68 | 20,686 | 18,532,799 | 31 |
| 88 | Gabon | 6,400 | 3,089 | 997 | 11,568 | 1,330,182 | 27 |
| 89 | Panama | 14,000 | 4,286 | 2,674 | 19,485 | 3,340,605 | 25 |
| 90 | Cyprus | 0 | 990 | 0 | 21,277 | 854,673 | 25 |
| 91 | Mozambique | 0 | 55,200 | 0 | 7,790 | 21,372,202 | 20 |
| 92 | Mali | 0 | 34,600 | 94 | 6,863 | 12,334,168 | 19 |
| 93 | Costa Rica | 185,600 | 3,252 | 144,339 | 26,267 | 4,462,193 | 19 |
| 94 | Ethiopia | 0 | 69,585 | 0 | 19,395 | 79,086,894 | 17 |
| 95 | Jamaica | 0 | 3,832 | 2 | 11,430 | 2,675,800 | 16 |
| 96 | Malta | 0 | 844 | 0 | 7,449 | 409,197 | 15 |
| 97 | Guinea | 50,000 | 26,700 | 280 | 4,564 | 9,380,197 | 13 |
| 98 | Gambia | 2,550 | 34,000 | 1 | 644 | 1,706,767 | 13 |
| 99 | Fiji | 0 | 3,098 | 0 | 3,431 | 834,278 | 13 |
| 100 | Latvia | 0 | 1,029 | 16 | 27,155 | 2,276,100 | 12 |
| 101 | Kiribati | 0 | 13,413 | 0 | 78 | 95,067 | 11 |
| 102 | Niger | 0 | 29,326 | 2,299 | 4,170 | 14,195,085 | 8.62 |
| 103 | Argentina | 0 | 1,267 | 0 | 262,451 | 39,503,466 | 8.42 |
| 104 | Uzbekistan | 0 | 9,800 | 0 | 22,308 | 26,867,800 | 8.14 |
| 105 | Bosnia & Herzegovina | 0 | 1,957 | 13 | 15,144 | 3,772,964 | 7.86 |
| 106 | D.R. Congo | 104,000 | 47,353 | 652 | 8,953 | 62,399,224 | 6.79 |
| 107 | Belarus | 0 | 1,400 | 0 | 44,773 | 9,702,000 | 6.46 |
| 108 | Libya | 0 | 681 | 0 | 58,333 | 6,156,488 | 6.45 |
| 109 | Burkina Faso | 0 | 13,800 | 484 | 6,767 | 14,777,431 | 6.32 |
| 110 | Estonia | 0 | 381 | 2 | 20,901 | 1,341,672 | 5.94 |
| 111 | Togo | 7,000 | 14,635 | 2,226 | 2,499 | 6,580,669 | 5.56 |
| 112 | Thailand | 965,000 | 1,407 | 283,065 | 245,351 | 63,832,135 | 5.41 |
| 113 | Rwanda | 0 | 15,691 | 0 | 3,339 | 9,735,541 | 5.38 |
| 114 | Cote d’Ivoire | 288,819 | 5,021 | 89,381 | 19,796 | 19,268,303 | 5.16 |
| 115 | Madagascar | 3,500 | 13,623 | 308 | 7,382 | 19,669,953 | 5.11 |
| 116 | Mongolia | 0 | 3,368 | 0 | 3,930 | 2,608,412 | 5.07 |
| 117 | Guyana | 0 | 3,150 | 0 | 1,080 | 738,548 | 4.61 |
| 118 | Cambodia | 0 | 7,185 | 2,546 | 8,350 | 14,446,056 | 4.15 |
| 119 | Macedonia | 0 | 1,037 | 10 | 7,674 | 2,037,032 | 3.91 |
| 120 | Botswana | 0 | 513 | 0 | 12,311 | 1,881,432 | 3.36 |
| 121 | Liberia | 34,800 | 16,581 | 638 | 735 | 3,713,868 | 3.28 |
| 122 | Moldova | 0 | 2,717 | 0 | 4,396 | 3,803,704 | 3.14 |
| 123 | Honduras | 175,000 | 1,728 | 178,047 | 12,234 | 7,103,786 | 2.98 |
| 124 | Papua New Guinea | 395,000 | 3,000 | 368,300 | 6,259 | 6,324,097 | 2.97 |
| 125 | Zambia | 0 | 2,863 | 0 | 11,363 | 11,919,870 | 2.73 |
| 126 | Seychelles | 0 | 310 | 0 | 728 | 85,032 | 2.65 |
| 127 | Sierra Leone | 36,000 | 8,964 | 152 | 1,664 | 5,848,320 | 2.55 |
| 128 | Samoa | 0 | 870 | 0 | 525 | 181,293 | 2.52 |
| 129 | Albania | 0 | 708 | 0 | 10,831 | 3,181,326 | 2.41 |
| 130 | Indonesia | 16,900,000 | 1,154 | 8,875,419 | 432,817 | 225,630,065 | 2.21 |
| 131 | Malawi | 0 | 8,632 | 0 | 3,563 | 13,920,062 | 2.21 |
| 132 | Iceland | 0 | 28 | 0 | 19,963 | 310,997 | 1.8 |
| 133 | Kyrgyz Republic | 0 | 2,374 | 0 | 3,745 | 5,234,800 | 1.7 |
| 134 | Comoros | 0 | 2,246 | 0 | 449 | 628,410 | 1.6 |
| 135 | Guinea-Bissau | 6,350 | 6,942 | 9 | 357 | 1,694,653 | 1.46 |
| 136 | Georgia | 0 | 537 | 0 | 10,175 | 4,398,588 | 1.24 |
| 137 | Armenia | 0 | 390 | 0 | 9,204 | 3,009,162 | 1.19 |
| 138 | Nigeria | 1,300,000 | 726 | 157 | 165,469 | 147,982,941 | 0.81 |
| 139 | Bahamas | 0 | 37 | 0 | 6,571 | 331,140 | 0.73 |
| 140 | Bolivia | 0 | 420 | 13,120 | 9,517,537 | 0.58 | |
| 141 | Central African Republic | 1,700 | 1,352 | 0 | 1,712 | 4,343,405 | 0.53 |
| 142 | Turkmenistan | 0 | 100 | 12,933 | 4,963,332 | 0.26 | |
| 143 | St. Lucia | 0 | 44 | 0 | 980 | 167,975 | 0.26 |
| 144 | Ecuador | 295,000 | 76 | 171,638 | 44,490 | 13,339,580 | 0.25 |
| 145 | Montenegro | 0 | 41 | 3,477 | 599,006 | 0.24 | |
| 146 | St. Kitts & Nevis | 0 | 20 | 527 | 48,790 | 0.22 | |
| 147 | Bhutan | 0 | 79 | 1,096 | 657,401 | 0.13 | |
| 148 | Cape Verde | 0 | 48 | 1,434 | 530,269 | 0.13 | |
| 149 | St. Vincent & the Grenadines | 0 | 26 | 553 | 120,325 | 0.12 | |
| 150 | Vanuatu | 0 | 57 | 1 | 452 | 225,898 | 0.11 |
| 151 | Luxembourg | 0 | 1 | 0 | 49,460 | 479,993 | 0.1 |
| 152 | Swaziland | 0 | 30 | 0 | 2,894 | 1,147,616 | 0.08 |
| 153 | Solomon Islands | 35,800 | 34 | 19,745 | 388 | 495,362 | 0.03 |
| 154 | Tonga | 0 | 10 | 253 | 102,214 | 0.02 | |
| 155 | Burundi | 1,800 | 167 | 98 | 974 | 8,495,915 | 0.02 |
| 156 | Nepal | 0 | 36 | 1,753 | 10,315 | 28,107,592 | 0.01 |
Literature Cited
- Butler, R. A. 2009a. Failure to support greener palm oil may lead industry to abandon environmental measures. Mongabay.com (accessed October 2009).
- Butler, R. A. 2009b. Sales of Certified Palm Oil Grow. Mongabay.com (accessed October 2009).
- Butler, R. A., and W. F. Laurance. 2009. Is oil palm the next emerging threat to the Amazon? Tropical Conservation Science 2: 1-10.
- Danielsen, F., et al. 2009. Biofuel plantations on forested lands: double jeopardy for biodiversity and climate. Conservation Biology 23: 348-358.
- FAO 2009. FAOSTAT Online Statistical Service. Food and Agriculture Organization of the United Nations, Rome, Italy. Available from http://faostat.fao.org (accessed October 2009).
- Koh, L. P., J. Ghazoul, R. A. Butler, W. F. Laurance, N. S. Sodhi , J. Mateo-Vega, and C. J. A. Bradshaw. 2009. Wash and spin cycle threats to tropical biodiversity. Biotropica: in press.
- Koh, L. P., and D. S. Wilcove. 2008. Is oil palm agriculture really destroying tropical biodiversity? Conservation Letters 1: 60-64.
- Laurance, W. F., L. P. Koh, R. A. Butler, N. S. Sodhi , C. J. A. Bradshaw, J. D. Neidel, H. Consunji, and J. Mateo-Vega. 2009. Improving the performance of the Roundtable on Sustainable Palm Oil for nature conservation. Conservation Biology: in press.
- RSPO 2009. Proceedings of the 6th Roundtable Meeting on Sustainable Palm Oil, 18-20th November, Bali, Indonesia. Roundtable on Sustainable Palm Oil (RSPO), Petaling Jaya, Malaysia. (accessed October 2009).
- USDA-FAS 2009. Oilseeds: World Markets and Trade. Circular Series FOP 9-09. United States Department of Agriculture-Foreign Agricultural Service (USDA-FAS), Washington, DC. (accessed October 2009).
- Wilcove, D. S., and L. P. Koh. 2009. Addressing the threats to biodiversity from oil palm agriculture. Biodiversity and Conservation: in press.
World Bank 2009. World Development Indicators 2009. World Bank, Washington, DC.


