The EU is the world’s second largest source of carbon dioxide emissions from peatlands drainage, after Indonesia, reports the first country-by-country assessment of peat stocks.
The study, conducted by Wetlands International and Greifswald University, found that drainage of wetlands for agriculture, forestry and peat extraction causes 1.3 billion tons of carbon dioxide emissions per year. Emissions from fires and peat mining (for horticulture and fuel) amount to another 700,000 million tons per year.
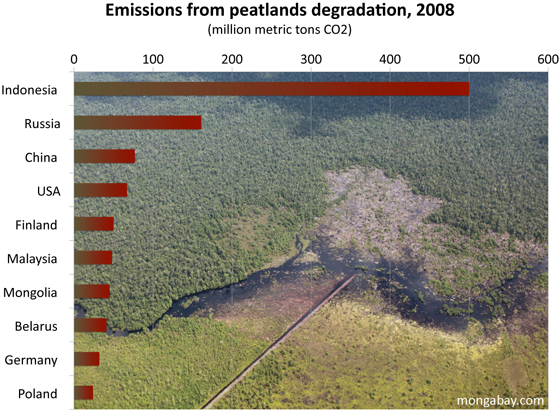
Emissions from peatlands degradation are highest in Indonesia at 500 million tons per year. Indonesia’s peatlands are being rapidly converted for agriculture, especially oil palm plantations.
The EU — led by Finland (50 million tons), Germany (32 million tons), and Poland (24 million tons) — is the second largest source of peatland emissions, due largely to agriculture and forestry.
Russia (160 million tons) is third due to peat fires, extraction, and drainage for forestry and agriculture. The United States is fourth.
The assessment, which estimates that global peatlands lock up more than 1.4 trillion tons of carbon, found the peat emissions have increased by more than fifth since 1990. Most of the increase has occurred in developing countries, with the largest growth occurring in Indonesia, China, Malaysia and Papua New Guinea.
The report shows that in 15 countries emissions due to peatland degradation are higher than emissions from fossil fuels use. For example, Iceland’s emissions from peatlands degradation are nearly 800 percent of its fossil fuels emissions. Uganda (739 percent), Mongolia (480 percent), Papua New Guinea (433 percent), Guyana (265 percent), and Indonesia (150 percent) also have high emissions from peat to fossil fuel.
The report notes that peatland emissions are not currently addressed under the Kyoto climate treaty and concludes that reducing peatlands degradation is one of the most cost-effective ways to help mitigate climate change.
“Peatland rewetting may globally reduce greenhouse gas emissions [by] several hundred million tons of carbon dioxide per year,” the report states.
Developing countries could be among the biggest beneficiaries under a climate agreement that compensates reductions in emissions from peatlands degradation.
The Global Peatland CO2 Picture
CHARTS/TABLES: Peat emissions by country
Emissions from degrading peat 2008 (million tons CO2)
| Country/area | 2008 peat emissions | |
| Indonesia | 500 | |
| Russia | 161 | |
| China | 77 | |
| USA | 67 | |
| Finland | 50 | |
| Malaysia | 48 | |
| Mongolia | 45 | |
| Belarus | 41 | |
| Germany | 32 | |
| Poland | 24 | |
| Russia Asian part | 22 | |
| Uganda | 20 | |
| Papua New Guinea | 20 | |
| Iceland | 18 | |
| Sweden | 15 | |
| Brazil | 12 | |
| United Kingdom | 10 | |
| Estonia | 10 | |
| Ireland | 8 | |
| Lithuania | 6 | |
| Netherlands | 6 | |
| Norway | 6 | |
| Vietnam | 5 | |
| Ukraine | 5 | |
| Zambia | 5 | |
| Japan | 5 | |
| Canada | 5 |
Country rank by peat area (square kilometers)
| Country/area | Peat area | |
| Russia – Asian part | 1176280 | |
| Canada | 1133926 | |
| Indonesia | 265500 | |
| Russia – European part | 199410 | |
| USA (Alaska) | 131990 | |
| USA (lower 48) | 91819 | |
| Finland | 79429 | |
| Sweden | 65623 | |
| Papua New Guinea | 59922 | |
| Brazil | 54730 | |
| Peru | 49991 | |
| China | 33499 | |
| Sudan | 29910 | |
| Norway | 29685 | |
| Malaysia | 26685 | |
| Mongolia | 26291 | |
| Belarus | 22352 | |
| United Kingdom | 17113 | |
| Germany | 16668 | |
| Congo | 15999 | |
| Zambia | 15410 | |
| Uganda | 13640 | |
| Iceland | 13366 | |
| DR Congo | 11955 | |
| Poland | 11528 |
Country rank by peat carbon stock 2008 (million tons of carbon)
| Country | Peat carbon stock | |
| Canada | 154972 | |
| Russia Asian part | 117607 | |
| Indonesia | 54016 | |
| Russia European part | 19948 | |
| USA (Alaska) | 15499 | |
| USA (lower 48) | 13668 | |
| Papua New Guinea | 5983 | |
| Brazil | 5440 | |
| Malaysia | 5431 | |
| Finland | 5294 | |
| Sweden | 5000 | |
| China | 3224 | |
| Norway | 2230 | |
| Germany | 2018 | |
| Venezuela | 1984 | |
| Sudan | 1980 | |
| United Kingdom | 1745 | |
| Congo | 1600 | |
| Mexico | 1483 | |
| Uganda | 1321 | |
| Belarus | 1305 | |
| Dem. Republic of the Congo | 1190 | |
| Falkland Islands / Islas Malvinas | 1151 | |
| Ireland | 1130 | |
| Chile | 1124 |


