Researchers today released a long-awaited tool that reveals the extent of forest cover loss and gain on a global scale. Powered by Google’s massive computing cloud, the interactive forest map establishes a new baseline for measuring deforestation and forest recovery across all of the world’s countries, biomes, and forest types.
The map has far-reaching implications for efforts to slow deforestation, which accounts for roughly ten percent of greenhouse gas emissions produced by human activities, according to the authors of the paper that describes the tool and details its first findings.
“People will use these data in ways we can’t even imagine today,” said Matthew Hansen, a University of Maryland geographer who is the lead author of the study, which will be published in tomorrow’s issue of the journal Science. “Brazil had used Landsat data to document its deforestation trends and to inform policy and they also shared their data publicly. But such data has not been widely available for other parts of the world. Our global mapping of forest cover lifts the veil—revealing what’s happening on the ground in places people could only conjecture about before.”
The map does not distinguish between natural forests and plantations, but the underlying database will support the development of additional layers, which can be used to create masks for oil palm and timber plantations, enabling users to distinguish between deforestation, replanting of plantations, and conversion of forests to plantations.
The study finds that some 2.3 million square kilometers (888,000 square miles) of forest was lost between 2000 and 2012. But that area was partly offset by 800,000 sq km of forests that regrew. Forest loss was highest in the tropics, which was the only region in the world where deforestation is increasing.
But the power of the map lies in its granularity which comes from its 30 meter resolution and consistency in defining forest cover. For example, while Brazil’s sharp fall in forest loss since 2004 is widely known, the drop has been outpaced by surging deforestation in Indonesia, Malaysia, Paraguay, Bolivia, Zambia, and Angola. Counterintuitively, Indonesia experienced a jump in deforestation after it established a moratorium on granting new concessions in primary forest areas and peatlands.

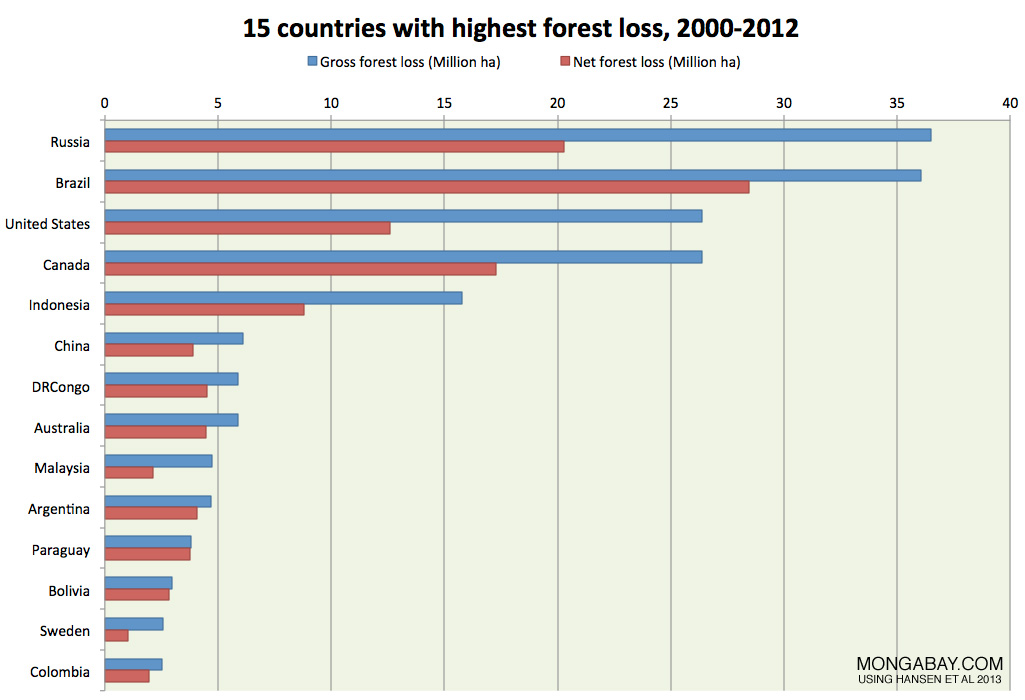
Outside the tropics, Russia is losing upwards of 3.6 million hectares of forest per year, an area that is only partially offset by forest recovery. Even the United States experienced significant forest clearing between 2000 and 2012, amounting to a net less of 12.6 million hectares. Disturbance rates in the southeastern United States were more four times greater than those of South American rainforests.
At the ecozone level, tropical rainforests (601,071 sq km), boreal coniferous forest (350,135 sq km), and tropical moist deciduous forest (300,149) experienced the largest area of forest loss. But it was less well-known forests were most heavily decimated during the study period.
“The tropical dry forests of South America had the highest rate of tropical forest loss, due to deforestation dynamics in the Chaco woodlands of Argentina, Paraguay, and Bolivia,” the researchers write. “Eurasian rainforests and dense tropical dry forests of Africa and Eurasia also had high rates of loss.”


Unlike most previous forest assessments — like the industry standard Forest Resource Assessments (FRA) from the U.N. Food and Agriculture Organization (FAO) — the new data go beyond mapping simple net change in forest cover, which can mask subtle but important ecological transformation like the shift from biodiversity-rich and carbon-dense old-growth forests to scrubbier degraded and secondary forests.
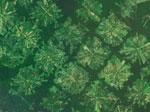
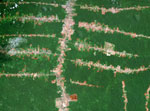
 Animation showing forest loss in Riau, on the Indonesian island of Sumatra. Much of this deforestation was to establish plantations for pulp and paper, timber, and palm oil production. Click image to enlarge. |
“Net deforestation targets are mostly ambiguous with respect to carbon emissions, biodiversity, and hydrological services because, according to the FAO-FRA methodology, low or even negative net deforestation may be reported even when there are large losses of native forests, if those losses are offset by increases in young secondary forests or tree plantations with inferior carbon, biodiversity, and hydrological service values,” write Sandra Brown and Daniel Zarin in a commentary accompanying the Science paper. “For this reason, and to safeguard the customary rights to native forests of indigenous and other local people, UNFCCC negotiators agreed to prohibit counting any carbon accumulation in plantations that substitute for native forests within countries’ voluntary commitments to REDD+.”
The new tool therefore represents a significant advancement toward understanding ecological changes that accompany changes in forest cover.
“This is the first map of forest change that is globally consistent and locally relevant,” said Hansen. “Losses or gains in forest cover shape many important aspects of an ecosystem including, climate regulation, carbon storage, biodiversity and water supplies, but until now there has not been a way to get detailed, accurate, satellite-based and readily available data on forest cover change from local to global scales.”

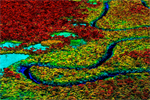
Regional subsets of 2000 tree cover and 2000 to 2012 forest loss and gain. (A) Paraguay, centered at 21.9°S, 59.8°W; (B) Indonesia, centered at 0.4°S, 101.5°E; (C) the United States, centered at 33.8°N, 93.3°W; and (D) Russia, centered at 62.1°N, 123.4°E. Image and caption courtesy of Science
The map wouldn’t have been possible without long-term collaboration between several institutions, including the University of Maryland, Google Inc, NASA, USGS, South Dakota State University, and the Woods Hole Research Center, among others. First touted publicly in 2008, the project has been in development nearly five years with significant financial support from the Gordon and Betty Moore Foundation.

Clarifying Google’s forest map |
The project leverages the massive computing power of Google Earth Engine, which processed some 650,000 NASA Landsat images to map forest loss and gain. According to Google, a process that “would have taken a single computer 15 years to perform was completed in a matter of days.”
“By combining the extensive Landsat database with the computing power of Google Earth Engine, Dr. Hansen saw an opportunity to do something that had never been done before,” said Rebecca Moore, head of Google Earth Engine and Earth Outreach at Google. “To date, this is the largest-scale scientific application of Earth Engine technology to measurement and mapping of earth’s natural resources.”
Google Earth Engine is also being used by other forest scientists, at places like the Carnegie Institution and Brazil-based Imazon, for other forest monitoring and mapping applications. Improved understanding of the state of forests through tools like these should boost the ability of decision makers — from lawmakers to business leaders — to establish policies that better protect forests.
“Brazil used Landsat data to document its deforestation trends, then used this information in its policy formulation and implementation,” said Hansen. “Now, with our global mapping of forest changes every nation has access to this kind of information, for their own country and the rest of the world.”

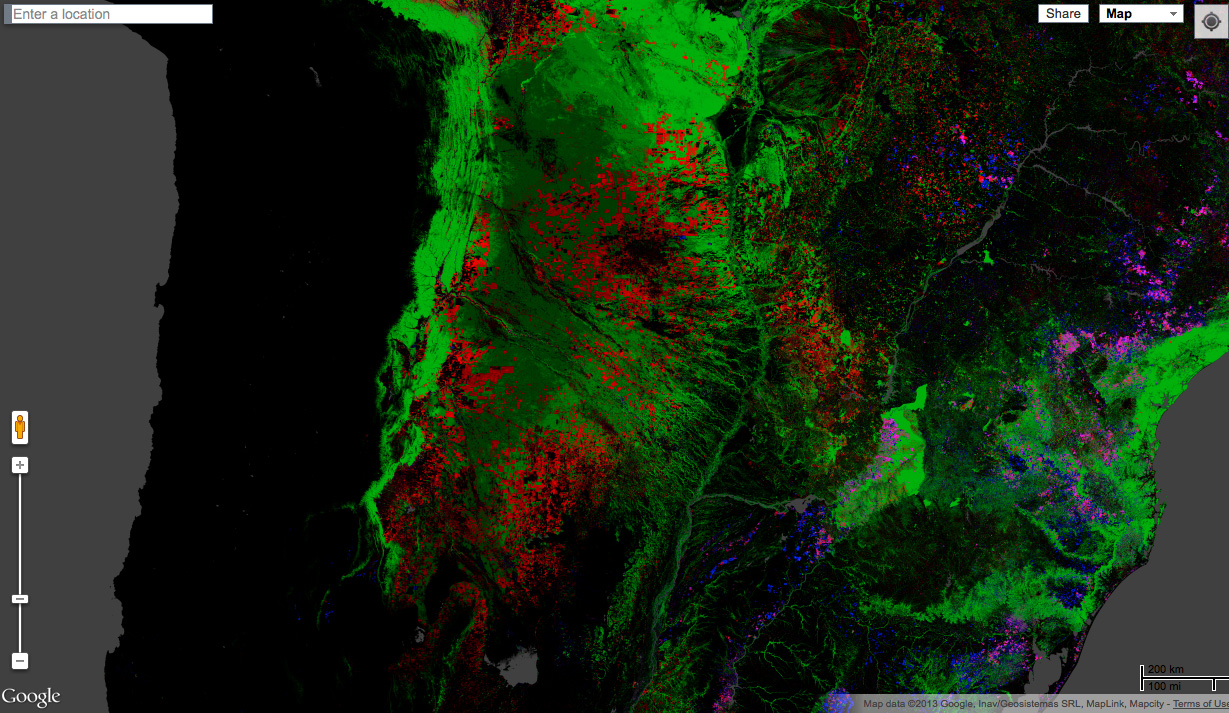
Forest map showing deforestation in the Chaco ecosystem

Forest map showing historical deforestation in the Brazilian Amazon
CITATIONS:
- Sandra Brown and Daniel Zarin. What Does Zero Deforestation Mean? SCIENCE VOL 342 15 NOVEMBER 2013
- Matt Hansen et al. High-Resolution Global Maps of 21st-Century Forest Cover Change. SCIENCE VOL 342 15 NOVEMBER 2013
50 countries with largest forest loss, 2000-2012
(sq km)
| country | Forest loss | Forest gain | Net loss* |
| Russia | 365015 | 162292 | 202723 |
| Brazil | 360277 | 75866 | 284411 |
| United States | 263944 | 138082 | 125862 |
| Canada | 263943 | 91071 | 172872 |
| Indonesia | 157850 | 69701 | 88149 |
| China | 61130 | 22387 | 38743 |
| DRCongo | 58963 | 13926 | 45037 |
| Australia | 58736 | 14142 | 44594 |
| Malaysia | 47278 | 25798 | 21480 |
| Argentina | 46958 | 6430 | 40528 |
| Paraguay | 37958 | 510 | 37448 |
| Bolivia | 29867 | 1736 | 28131 |
| Sweden | 25533 | 15281 | 10252 |
| Colombia | 25193 | 5516 | 19677 |
| Mexico | 23862 | 6333 | 17529 |
| Mozambique | 21552 | 1446 | 20106 |
| Tanzania | 19903 | 3041 | 16862 |
| Finland | 19516 | 10849 | 8667 |
| Angola | 19320 | 638 | 18682 |
| Peru | 15288 | 1910 | 13378 |
| Myanmar | 14958 | 3149 | 11809 |
| Cote d’Ivoire | 14889 | 2298 | 12591 |
| Madagascar | 14659 | 4051 | 10608 |
| Zambia | 13163 | 181 | 12982 |
| Venezuela | 12958 | 1910 | 11048 |
| Cambodia | 12595 | 1096 | 11499 |
| Vietnam | 12289 | 5643 | 6646 |
| Laos | 12084 | 3379 | 8705 |
| Thailand | 12049 | 4992 | 7057 |
| Chile | 11879 | 14611 | -2732 |
| Nigeria | 10239 | 603 | 9636 |
| South Africa | 9526 | 8313 | 1213 |
| India | 8971 | 2549 | 6422 |
| Guatemala | 8883 | 1094 | 7789 |
| Nicaragua | 8225 | 662 | 7563 |
| France | 7664 | 5062 | 2602 |
| Spain | 6908 | 4482 | 2426 |
| New Zealand | 6883 | 7102 | -219 |
| Papua New Guinea | 6337 | 2308 | 4029 |
| Philippines | 6227 | 2726 | 3501 |
| Poland | 5829 | 5041 | 788 |
| Ukraine | 5657 | 3529 | 2128 |
| Ghana | 5406 | 1345 | 4061 |
| Ecuador | 5246 | 1027 | 4219 |
| Portugal | 4987 | 2866 | 2121 |
| Germany | 4890 | 2585 | 2305 |
| Honduras | 4860 | 582 | 4278 |
| Cameroon | 4816 | 651 | 4165 |
| Mongolia | 4779 | 103 | 4676 |
| Central African Republic | 4719 | 395 | 4324 |
| Japan | 4303 | 2570 | 1733 |
| Belarus | 4167 | 3755 | 412 |
* negative number represents net gain in forest cover.
Related articles
Deforestation accelerates in Indonesia, finds Google forest map

(11/15/2013) Forest loss in Indonesia has sharply risen over the past 12 years, reports a new study published in the journal Science. The study, led by Matt Hansen of University of Maryland, finds that Indonesia lost 15.8 million hectares between 2000 and 2012, ranking it fifth behind Russia, Brazil, the United States, and Canada in terms of forest loss. Some 7 million hectares of forest regrew during the period.
Zero net deforestation is the wrong target, warn experts
(11/14/2013) Environmental initiatives that target zero net deforestation may miss their mark when it comes to slowing climate change and protecting biodiversity, warns a commentary published in this week’s issue of the journal Science. While zero net deforestation may seem like a worthy target in efforts to curb forest loss, Sandra Brown and Daniel Zarin argue that the goal is at best, ambiguous, and at worst, may lead to perverse outcomes for the world’s forests.
Video of Amazon gold mining devastation goes viral in Peru

(09/26/2013) Video of illegal gold mining operations that have turned a portion of the Amazon rainforest into a moonscape went viral on Youtube after a popular radio and TV journalist in Peru highlighted the story. Last week Peruvian journalist and politician Guido Lombardi directed his followers to video shot from a wingcam aboard the Carnegie Airborne Observatory (CAO), an airplane used by researchers to conduct advanced monitoring and analysis of Peru’s forests. The video quickly received more than 60,000 views on Youtube.
80% of rainforests in Malaysian Borneo logged

(07/17/2013) 80 percent of the rainforests in Malaysian Borneo have been heavily impacted by logging, finds a comprehensive study that offers the first assessment of the spread of industrial logging and logging roads across areas that were considered some of Earth’s wildest lands less than 30 years ago. The research, conducted by a team of scientists from the University of Tasmania, University of Papua New Guinea, and the Carnegie Institution for Science, is based on analysis of satellite data using Carnegie Landsat Analysis System-lite (CLASlite), a freely available platform for measuring deforestation and forest degradation. It estimated the state of the region’s forests as of 2009.
Conservation gets boost from new Landsat satellite
(04/03/2013) Efforts to monitor the world’s forests and other ecosystems got a big boost in February with the launch of Landsat 8, NASA’s newest earth observation satellite, which augments the crippled Landsat 7 currently orbiting Earth (technically Landsat 8 is still named the Landsat Data Continuity Mission (LDCM) and will remain so until May when the USGS turns control of the satellite over to NASA). Landsat 8/LDCM is the most advanced Earth observation satellite to date. It is the eighth Landsat since the initial launch in 1972.
Deforestation accounts for 10 percent of global carbon emissions, argues new study
(06/21/2012) Tropical deforestation accounted for 10 percent of global carbon dioxide emissions between 2000-2005 — a substantially smaller proportion than previously estimated — argues a new study published in Science. The paper estimates gross carbon emissions from deforestation at 810 million metric tons (with a 90 percent confidence interval of 0.57-1.22 billion tons) per year from 2000-2005, significantly below earlier calculations. Brazil and Indonesia accounted for 55 percent of gross emissions from tropical deforestation during the study period, while dry forests accounted for 40 percent of tropical forest loss but amounted to only 17 percent of emissions.
New Google Earth tool maps deforestation, threatened forests in Sumatra
(05/24/2012) The World Wildlife Fund (WWF) and a coalition of Indonesian environmental groups known as Eyes on the Forest have released a new Google Earth-based tool that maps forests, land use, carbon stocks, and biodiversity across the Indonesian island of Sumatra.
Model airplane used to monitor rainforests – conservation drones take flight
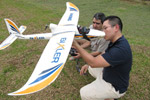
(02/23/2012) Conservationists have converted a remote-controlled plane into a potent tool for conservation. Using seed funding from the National Geographic Society, The Orangutan Conservancy, and the Denver Zoo, Lian Pin Koh, an ecologist at the ETH Zürich, and Serge Wich, a biologist at the University of Zürich and PanEco, have developed a conservation drone equipped with cameras, sensors and GPS. So far they have used the remote-controlled aircraft to map deforestation, count orangutans and other endangered species, and get a bird’s eye view of hard-to-access forest areas in North Sumatra, Indonesia.
Breakthrough technology enables 3D mapping of rainforests, tree by tree
(10/24/2011) High above the Amazon rainforest in Peru, a team of scientists and technicians is conducting an ambitious experiment: a biological survey of a never-before-explored tract of remote and inaccessible cloud forest. They are doing so using an advanced system that enables them to map the three-dimensional physical structure of the forest as well as its chemical and optical properties. The scientists hope to determine not only what species may lie below but also how the ecosystem is responding to last year’s drought—the worst ever recorded in the Amazon—as well as help Peru develop a better mechanism for monitoring deforestation and degradation.
How satellites are used in conservation
(04/13/2009) In October 2008 scientists with the Royal Botanical Garden at Kew discovered a host of previously unknown species in a remote highland forest in Mozambique. The find was no accident: three years earlier, conservationist Julian Bayliss identified the site—Mount Mabu—using Google Earth, a tool that’s rapidly becoming a critical part of conservation efforts around the world. As the discovery in Mozambique suggests, remote sensing is being used for a bewildering array of applications, from monitoring sea ice to detecting deforestation to tracking wildlife. The number of uses grows as the technology matures and becomes more widely available. Google Earth may represent a critical point, bringing the power of remote sensing to the masses and allowing anyone with an Internet connection to attach data to a geographic representation of Earth.
Development of Google Earth a watershed moment for the environment
(03/31/2009) Satellites have long been used to detect and monitor environmental change, but capabilities have vastly improved since the early 1970s when Landsat images were first revealed to the public. Today Google Earth has democratized the availability of satellite imagery, putting high resolution images of the planet within reach of anyone with access to the Internet. In the process, Google Earth has emerged as potent tool for conservation, allowing scientists, activists, and even the general public to create compelling presentations that reach and engage the masses. One of the more prolific developers of Google Earth conservation applications is David Tryse. Neither a scientist nor a formal conservationist, Tryse’s concern for the welfare of the planet led him develop a KML for the Zoological Society of London’s EDGE of Existence program, an initiative to promote awareness of and generating conservation funding for 100 of the world’s rarest species. The KML allows people to surf the planet to see photos of endangered species, information about their habitat, and the threats they face. Tryse has since developed a deforestation tracking application, a KML that highlights hydroelectric threats to Borneo’s rivers, and oil spills and is working on a new tool that will make it even easier for people to create visualizations on Google Earth. Tryse believes the development of Google Earth is a watershed moment for conservation and the environmental movement.