Earth’s tropical rainforests are a critical
component of the world’s carbon cycle yet cover only about 12% of its
terrestrial land. Accounting for 40% of the world’s terrestrial carbon and 50%
of the world’s gross primary productivity,[1].
the production of organic compounds primarily through photosynthesis, tropical
rainforests also are one of the engines driving Earth’s atmospheric circulation
patterns.
Asia is home to roughly 17% of the world’s
rainforests and to a large percentage of the world’s biodiversity. Asia’s
forests also have some of the highest deforestation rates [2].
In fact, fragmentary secondary forests in Asia now are greater than all
remaining old-growth primary rainforests in SE Asia [3].
This means that secondary lowland forests, such as Kalimantan’s peat forests,
must play a key role in biodiversity conservation, carbon emissions mitigation,
and sustainable economic development.
Borneo’s Speciation
Tropical forests, home to over 50% of the world’s species,[4].
are experiencing unprecedented deforestation. Indonesia’s forests on Borneo are
being deforested at a rate of roughly 2% a year [5].
It is estimated that the forests on Indonesia’s part of Borneo, which is called
Kalimantan, will be deforested by about 2020 [6].
Kalimantan’s forests have two broad ecological zones. In the lowland peat
forests, dipterocarp trees can reach over 60 meters, or roughly 200 feet, and
each tree is host to up to 1,000 insect species [7].
In the highland mountains, the forests are little explored or understood.
Borneo has the highest documented tree diversity on
Earth, with 1,175 species counted in one 52 hectare plot in Lambir Hills
National Park, Sarawak, Malaysia [8]. In fact,
more than 6,000 endemic plant species, 15,000 plant species, 2,000 species of
orchids, 265 dipterocarp tree species, and an estimated 700 tree species have
been recorded thus far in Borneo. For comparison, there are roughly only 50
tree species in Northern Europe [9].
Borneo’s Deforestation
The island of Borneo is Earth’s third largest
island, approximating 74,392,500 ha2 (square hectares). Three
countries share the island: Indonesia, Sultanate of Brunei Darussalam, and
Malaysia.
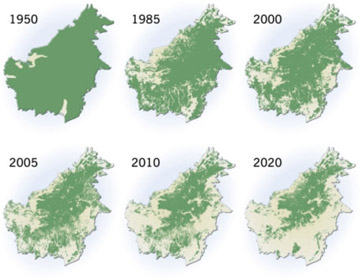
 Figure 1: Extent of Deforestation in Borneo 1950-2005, Projection to 2020 [2]
|
In Figure 1: Extent of Deforestation in Borneo 1950-2005, Projection to 2020, Borneo’s rate of deforestation, primarily in
Indonesia, can be understood as catastrophic and unprecedented. The amount of
land deforested in the last 20 years is about the same size as Texas and
California combined, or the total landmass of Spain or France. This astounding
rate of deforestation has resulted in an increase in Indonesia’s carbon
emission load, due to peatland fires and related decomposition of peat, to over
2 billion tons of carbon annually. This is equivalent to three times the German
economy and greater than Russia’s annual carbon emission rate [12].
Borneo’s forests, which only 20 years ago were dipterocarp primary tropical
rainforests, now are a patchwork quilt of palm oil plantations, degraded
forested land, and timber plantations [13].
Since 1983, Indonesia has experienced many
disastrous periodic forests fires during each El Niño Southern Oscillation
(ENSO) period. In
1997-98, an area the size of Connecticut and Rhode Island burned.
Borneo’s ecological system has characteristically
been driven by ENSO-related microclimate changes, with extensive drought in
each ENSO period. The drought conditions cause the dipterocarp trees to
synchronously bloom and then bear fruit, contributing food to vertebrate
populations that in turn feed larger vertebrates further up the food chain.
Because of unparalleled uncontrolled and
unmitigated deforestation, Kalimantan now experiences a destructive cycle
related to ENSO. ENSO causes widespread drought that is enhanced by
deforestation, lack of leaf transpiration, and draining of the lowland peat
forests [14].
The dry peat soil then is the fodder for remarkable forest fires that degrade
millions of hectares of Kalimantan’s rainforest. In fact, the forest fires are
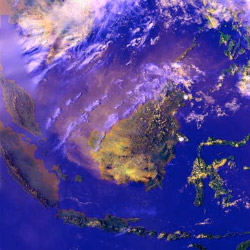
so large they can be seen from space (see Figure
2: Borneo’s Fires from Space September 22, 1997). During 1997-98, more than 5 million hectares of
rainforest burned in the province of East Kalimantan [15].
This burned area is an equivalent area to Connecticut and Rhode Island
combined.
These
forests fires would not have been as large if the forests had not been drained
or disturbed. Rainforest trees can trap transpired moisture that originates
from the surrounding biomass, thereby increasing humidity and decreasing fire
risk [16].
Also, most tropical trees have thin bark, and the bark of saplings is even thinner.
Because of this, seedlings and saplings are easily damaged by fire. Regeneration
of burned tropical rainforests requires sustained periods without severe fire
disturbance. Otherwise, mortality and regeneration are affected [17].
Once a fire has occurred, the same forest is prone
to secondary fires because of ecosystem changes. ENSO events in 1982-83 and
1997-98 had a significant effect on the rainforest ecosystems of Borneo with
increased fire damage. Furthermore, these events are expected to increase in
severity as global warming and associated climate changes accelerate [18].
 Figure 2: Borneo’s Fires from Space September 22, 1997 [19] |
Most
commercial timber in Borneo’s lowland peat forests is composed of dipterocarp
trees, roughly 90%. Dipterocarp trees are dense – 50 to 120 m3 per
hectare. When they are logged, about 80% of the canopy is destroyed [20].
In a primary dipterocarp forest, the above ground biomass is approximately 500
tons per hectare [21]. It is
estimated that only about 7% of the carbon released by the destruction of
tropical rainforests is reabsorbed through photosynthesis back into the fallow
remaining rainforests [22]. In fact,
the volume of dipterocarp timber exports from Borneo measured in cubic meters
is greater than all tropical wood exported from Latin America and Africa
combined since 1980 [23].
While there are many reasons a forest may burn, the
critical factors are forest clearance and draining of peat forests [24].
It is estimated that during the fires of 1997-98, 2.18 – 2.57 GT carbon were
released into the atmosphere as a result of fires throughout the Sumatra and
Kalimantan. This is about 40% of the emissions of fossil fuels from car
emissions annually globally,[25]. with a cost
to the local economy of roughly $9 billion USD [26].
This made Indonesia the third largest carbon-emitting nation globally [27].
Kalimantan’s Peat Forest Ecosystem
Peat forests are defined as terrestrial lands in
which over 80% of the area is covered by peat soil. Peat soil contains at least
30% organic matter by weight with greater than 40 cm in a cumulative layer [28].
Peat forests are wetlands with a thick layer of decomposing organic matter. Peat
forests occupy only 3% of Earth’s surface yet their carbon storage rate is approximately
525 gigatons of carbon. Peat forests therefore could store 15% of Earth’s
terrestrial carbon [29].
The hydrologic routing in Kalimantan’s peat forests
is dominated by ombrotrophic waters (from precipitation) with some
phreatotrophic waters (from groundwater). Kalimantan’s waters are mainly
palustrine and riverine. Yet little is known about the hydrarch succession
within Kalimantan’s lowland peat forests.
Sixty-eight
percent of the world’s tropical peat forests are in the area of the South China
Sea, including Indonesia [30]. Tropical peat
forests represent 10% of the world’s peat forests and 8% of the world’s
wetlands. This is an equivalent area of 500,000 km2. Tropical peat
forests account for about 40% of the carbon storage capacity in the world’s peat
forests, equivalent to 200 GT carbon. Kalimantan contains 68,000 km2
of peat forests [31].
Accordingly, Indonesia’s Kalimantan peat forests have a carbon storage capacity
of 27 GT carbon, and during ENSO years, which are characteristic of relative
drought in Kalimantan’s lowland peat forests, carbon fluxes increase as carbon
is emitted from the drying peat soils [32].
Carbon is emitted because as the organic matter in peat soils dries, it goes
through either aerobic or anaerobic decomposition, which releases CO2,
CH4, and N2O into the atmosphere. Tropical peat forests
in Kalimantan have relatively high temperatures, and some suggest that a rise
in global temperatures will increase forest temperatures, increasing carbon
release rates from decomposing woody debris [33].
But hydrological conditions dominate lowland peat forests as this relates to
carbon storage.
In
Kalimantan, there are no large seasonal changes in evapotranspiration [34].
Small variation in water table levels shows only a small change on soil CO2
flux rates [35].
This means that when the water table lowers through drought during an ENSO year
or when peat forests are drained for large-scale agricultural endeavors such as
palm oil plantations, CO2-releasing decomposition increases rapidly.
The above analysis took into account microtopographically hummock and hollow
peat surfaces. Hummocks, areas
where tree roots collect woody debris causing an increase in the level of
organic carbon, are higher than hollows, which are depressed areas where water
collects. Anoxic waterlogged peat that is located under the water table
releases CH4. This suggests that water table decreases cause an increase
in CH4 emissions. Assuming less than 5% change in peatland forest
floor emissions for each 10% change in hummock/hollow microtopographic change,
one can adjust data accordingly [36].
We
face many challenges as we develop our global carbon-neutral economy.
Sustainably developing the economy of Kalimantan in a fashion that protects our
global carbon bank stored within its peat forests should be one of primary objectives
as global governments convene in Copenhagen next week to discuss climatic
disruption mitigation policy. Specifically, at the local level, Indonesia may
choose to develop its information sharing capacity in rural Kalimantan by
increasing democratic management techniques regarding forestry practices[37].
mimicking the success of the Katingan Peat Forest project[38].
while emphasizing sustainable economic development that does no further harm to
the unique peat forests of Kalimantan.
Gabriel
Thoumi is a forest carbon project developer and consultant with Forest Carbon
Offsets, LLC. He is a graduate with from the University of Michigan with an MBA,
MSc, and a Graduate Certificate in Real Estate Development. He is also an
approved Lead Verifier under the Climate Action Reserve Forest and Urban Forest
Protocols. He can be reached at gabrielthoumi -at- forestcarbonoffsets.net.
References
[1]. Kumagai,
Tomo’omi et al. “Carbon and water cycling in a Bornean tropical rainforest
under current and future climate scenarios.” Advances in Water Resources
27 (2004): 1136 – 1150.
[2]. Kumagai,
Tomo’omi et al. “Carbon and water cycling in a Bornean tropical rainforest
under current and future climate scenarios.” Advances in Water Resources
27 (2004): 1136 – 1150.
[3]. Silk, J.W.F.
“Assessing tropical lowland forest disturbance using plant morphology and
ecological attributes.” Forest and Ecology Management 205 (2005): 241 –
250.
[4]. Rainforest
Diversity – Origins and Implications. 10 Apr. 2007 Tropical Rainforests.
https://www.mongabay.com.
[5]. Global
Forest Watch. 10 Apr. 2007. Global Forest Watch. http://www.globalforestwatch.org/english/indonesia/index.htm.
[6]. Indonesia: Environment and Natural Resource
Management in a Time of Transition. Washington, DC: World Bank, 2001.
[7]. Peo,
Dorethea. Borneo’s Lost World: Newly Discovered Species on Borneo.
Jakarta: WWF Indonesia, 2005.
[8]. Peo,
Dorethea. Borneo’s Lost World: Newly Discovered Species on Borneo.
Jakarta: WWF Indonesia, 2005.
[9]. Peo,
Dorethea. Borneo’s Lost World: Newly Discovered Species on Borneo.
Jakarta: WWF Indonesia, 2005.
[10]. Peo,
Dorethea. Borneo’s Lost World: Newly Discovered Species on Borneo.
Jakarta: WWF Indonesia, 2005.
[11]. Extent
of deforestation in Borneo 1950-2005, and projection towards 2020. Map. New
York: UNEP/GRID-Arendal
Maps and Graphics Library, 2007. Cartographer, Hugo Ahlenius.
[12] Joosten, Hans. “The Global Peatland CO2 Picture Peatland
status and drainage related emissions in all countries of the world.”
Greifswald University: Wetlands International, Ede, 2009. http://news.mongabay.com/2009/1104_peat_emissions_data.html
[13]. Dennis,
Rona A. “Impacts on land use and fire on the loss and degradation of lowland
forest in 1983-2000 in East Kutai District, East Kalimantan, Indonesia.”
Singapore Journal of Tropical Geography 27(2006): 30 – 48.
[14]. Curran, L.
M. et al. “Lowland forest loss in protected areas of Indonesian Borneo.”
Science 303 (2004): 1000 – 1003.
[15]. Cleary,
Daniel F.R. “Vegetation responses to burning of a rain forest in Borneo.” Plant
Ecology 177 (2005): 145 – 163.
[16]. Cleary,
Daniel F.R. “Vegetation responses to burning of a rain forest in Borneo.” Plant
Ecology 177 (2005): 145 – 163.
[17]. Cleary,
Daniel F.R. “Vegetation responses to burning of a rain forest in Borneo.” Plant
Ecology 177 (2005): 145 – 163.
[18]. Cleary,
Daniel F.R. “Vegetation responses to burning of a rain forest in Borneo.” Plant
Ecology 177 (2005): 145 – 163.
[19]. Borneo
Fires. Photo. NASA Goddard Space Flight Center. September 22, 1997, as
viewed by the NOAA-14. Produced by Hal Pierce and Fritz Hasler. 12 Apr 2007. http://rsd.gsfc.nasa.gov/rsd/images/Borneo.html.
[20]. Curran, L. M. et al. “Lowland
forest loss in protected areas of Indonesian Borneo.” Science 303 (2004):
1000 – 1003.
[21]. Hashimoto,
Toru et al. “Changes in carbon storage in fallow forests in the tropical
lowlands of Borneo.” Forest Ecology and Management 126 (2000): 331 –
337.
[22]. Hashimoto,
Toru et al. “Changes in carbon storage in fallow forests in the tropical
lowlands of Borneo.” Forest Ecology and Management 126 (2000): 331 –
337.
[23]. Curran, L.
M. et al. “Lowland forest loss in protected areas of Indonesian Borneo.”
Science 303 (2004): 1000 – 1003.
[24]. Page, Susan
E. et al. “The amount of carbon released from peat and forest fires in
Indonesia during 1997.” Nature 420 (2002): 61 – 65.
[25]. Page, Susan
E. et al. “The amount of carbon released from peat and forest fires in
Indonesia during 1997.” Nature 420 (2002): 61 – 65.
[26]. Indonesia: Environment and Natural Resource
Management in a Time of Transition. Washington, DC: World Bank, 2001.
[27]. “Shocking climate impact of wetland
destruction in Indonesia.” Online press release. 11 Feb. 2006. Wetlands
International. 10 Apr. 2007 http://www.wetlands.org/news.aspx?ID=2817de3d-7f6a-4eec-8fc4-7f9eb9d58828.
[28] “Revised Legend of the FAO-Unesco Soil Map of the
World.” World Soil Resources Report 60 (1988) 109.
[29] Takai, Y. “Environmental Characteristics and
Management in Peat/Acid Sulfate Soils of Southeast Asia.” MAB Report, Japan,
1996–1997: 31 – 49.
[30]. Jauhiainen,
Jyrki et al. “Carbon fluxes from a tropical peat swamp forest floor.” Global
Change Biology 11 (2005): 1788 – 1797.
[31] Page, Susan E. et al. “Interdependence of peat and
vegetation in a tropical peat swamp forest.” Philosophical Transactions:
Biological Sciences 354 (1999): 1885 – 1897.
[32] Hirano, Takashi et al. “Carbon dioxide balance of a
tropical peat swamp forest in Kalimantan, Indonesia.” Global Change Biology
13 (2007): 412 – 425.
[33] Chimner RA. “Soil respiration rates of tropical
peatlands in Micronesia and Hawaii.” Wetlands 24 (2004): 51–56.
[34]. Jauhiainen,
Jyrki et al. “Carbon fluxes from a tropical peat swamp forest floor.” Global
Change Biology 11 (2005): 1788 – 1797.
[35]. Chimner RA.
“Soil respiration rates of tropical peatlands in Micronesia and Hawaii.” Wetlands
24 (2004): 51–56.
[36]. Jauhiainen,
Jyrki et al. “Carbon fluxes from a tropical peat swamp forest floor.” Global
Change Biology 11 (2005): 1788 – 1797.
[37]. Padmanaba,
Michael. “Finding and promoting a local conservation consensus in a globally
important tropical forest landscape.” Biodiversity Conservation 16
(2007): 137 -151.
[38]. O’Brien,
Tim. “Conservation and Carbon in Borneo’s Heart and Ours”. http://news.mongabay.com/2009/1104-obrien_katingan.html


