- As global warming drives more events that impact coral reefs, managing the Great Barrier Reef’s resilience demands comprehensive and detailed mapping of the reef bed.
- Available surveys and maps with geographically referenced field data have been limited and fragmented.
- A diverse research team recently demonstrated a successful approach, applying statistics to image data to build predictive models, integrate diverse datasets on reef conditions, and provide a comprehensive map of the Reef that informs reef management decisions.
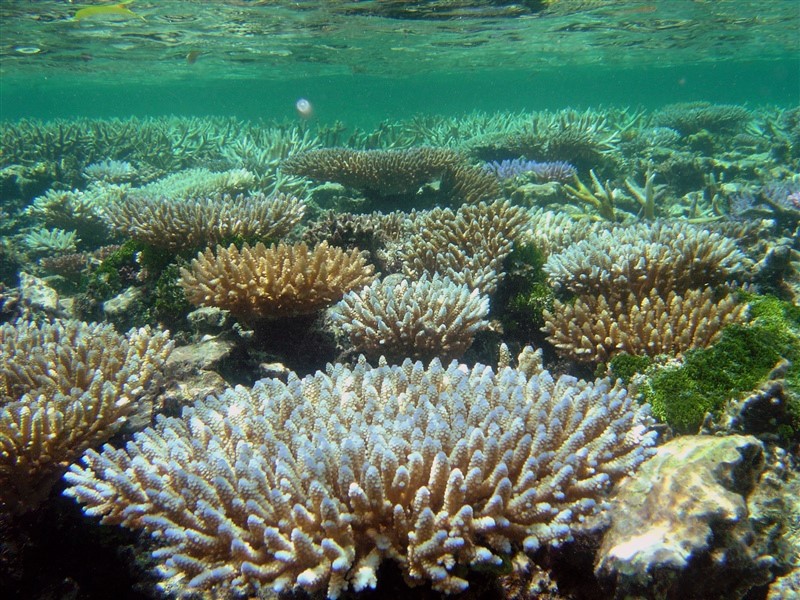
Any aquarist who has tried to grow a variety of the colorful Acropora coral in a hobby tank knows how delicate they are – “not for beginners.” And yet this sensitive group of hard, branching corals dominates the coral population of the Great Barrier Reef, lending color, structure, and tourist appeal.

In April of this year, reports came out that the annual spawning of this coral showed a low rate of recruitment (growth of infant coral within a reef). These coral communities had been devastated when sea temperature rise drove back-to-back bleaching events in 2016 and 2017. It can take an Acropora coral community 9–12 years to recover from a severe bleaching event.
A new approach to managing reef data
In Queensland, Australia, a diverse group of organizations overseeing the Great Barrier Reef are committed to helping Acropora regeneration efforts. But they all need comprehensive maps – not necessarily containing the same information – of the Reef.
In response, a multi-institutional research team has developed a public-access, predictive mapping tool that combines image data from professionals and citizen scientists to predict coral cover.
“Citizen scientists, professional scientists, the tourism industry, indigenous communities, multiple sectors of our society are interested and invested in understanding the changes coral reefs are facing,” said Manuel González-Rivero with the Australian Institute of Marine Science.
For scientists hoping to seed new Acropora colonies on the reef, for example, it’s important to know where healthy, similar colonies are located.

“Once corals release their egg-sperm bundles into the ocean and break apart,” says Alannah Vellacott with the Perry Institute for Marine Science, “fertilization success depends on sperm from one colony finding eggs from another.”
From seeding new colonies to eradicating the voracious crown-of-thorns starfish, which eats coral polyps, reef managers are looking for fine-scale reef information to help develop solutions, González-Rivero told Mongabay. Over time, the interested organizations have collected data on various aspects of the Reef, but their respective datasets differ in type, quality, time period, and spatial extent, so they have never been combined in a single analysis.
Recent modeling work by Erin E. Peterson, a research fellow at Queensland University of Technology (QUT), and colleagues promises to address this need. Using predictive statistical models, Peterson, González-Rivero, and colleagues have developed a mapping tool to compile and map photographic data on these hard corals collected and/or classified by professional and citizen scientists. The new tool uses the models to integrate the diverse datasets, assigning values to survey data to account for differences in survey method and quality.
The unique modeling approach, detailed in a recent paper, has led to “the most comprehensive map” to date of the Great Barrier Reef (GBR), according to Peterson, which will provide users with spatially and temporally explicit information to guide research and management.

The push to concentrate data is all part of the Australian government’s Reef 2050 Integrated Monitoring and Reporting Program with a mission to “create a knowledge system that enables resilience-based adaptive management of the Great Barrier Reef and its catchment.”
Capturing uncertainty
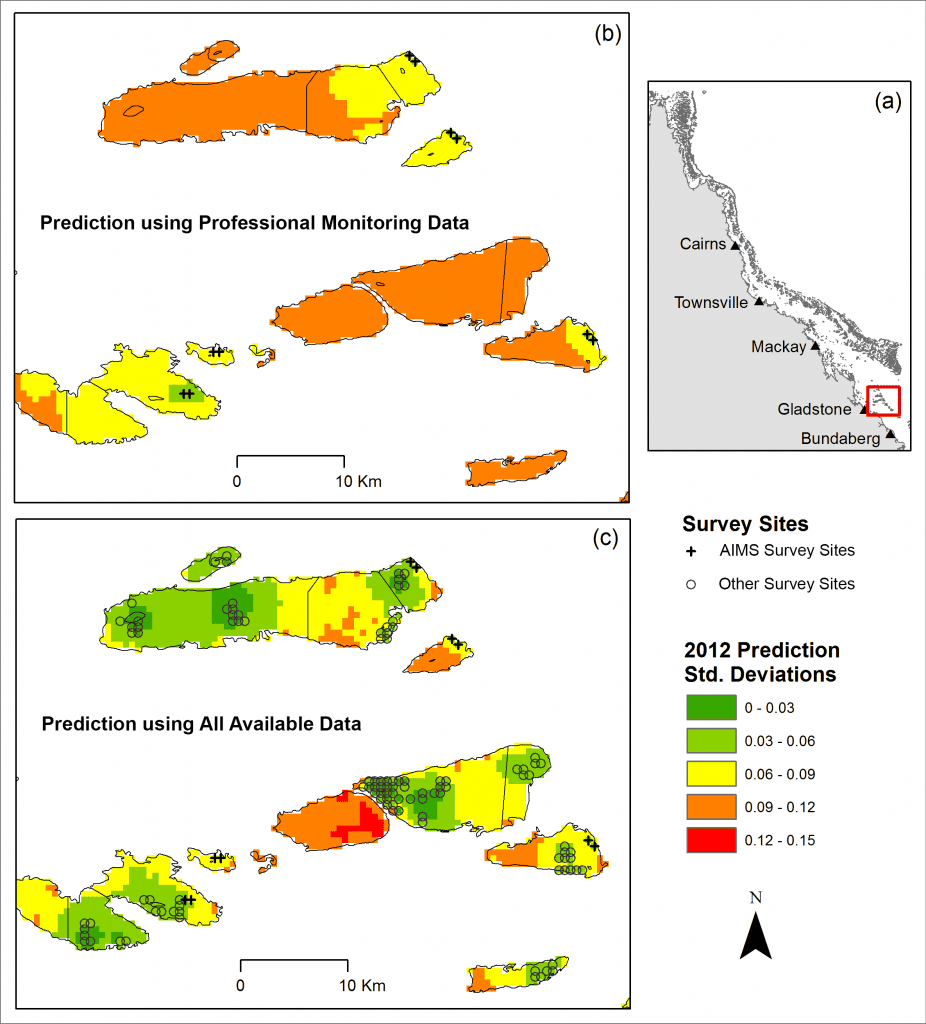
The new model predicts the proportion of a given image pixel covered by coral and includes a “level of uncertainty” with all predictions, which managers can factor in when making decisions.
“Predictive maps with estimates of uncertainty can be used to prioritize management actions, inform the design of monitoring programs, and guide coordinated monitoring efforts within and across organizations,” the paper reports, “and provide scientifically rigorous information, summarized at multiple scales.”
The authors state that the new integrated mapping tool can help users to:
- report on coral status and trends, including changes in coral health,
- expand the scope covered by monitoring activity, to help capture spatial and temporal heterogeneity within and between large regions,
- identify areas needing additional monitoring data before taking action, and
- evaluate the management effectiveness of the Reef 2050 Plan.
The map’s predictive accuracy improves the more datasets it ingests. The team tested the model using citizen science data obtained via an online classification tool called Virtual Reef Diver (VRD), and the model performed well.
The researchers tested their model using one dataset collected just by official monitoring programs and another that also incorporated additional data collected by citizen scientists, universities, and other groups. Adding the additional data increased the predictive ability of the models, which provides more accurate and precise information about coral cover across the whole of the GBR.

“Results to date,” Peterson told Mongabay, “show that integrating image-based data from multiple organizations significantly increases the accuracy of model predictions.”
Expanding datasets through citizen science
Now Peterson’s team is about to combine forces with the Great Barrier Reef Marine Park Authority (GBRMPA), the Reef’s primary management agency, which has its own citizen science program and data collected through a program called Eye on the Reef.
A Queensland Citizen Science Grant will allow QUT, GBRMPA, and Great Barrier Reef Legacy to expand the VRD project, says Peterson. Both the Australian Government’s Reef Trust and the Great Barrier Reef Foundation have supported the project.
“The project will integrate the largest participatory science program, the Eye on the Reef, [and] other citizen science initiatives, with the aim of integrating monitoring observations,” González-Rivero said.
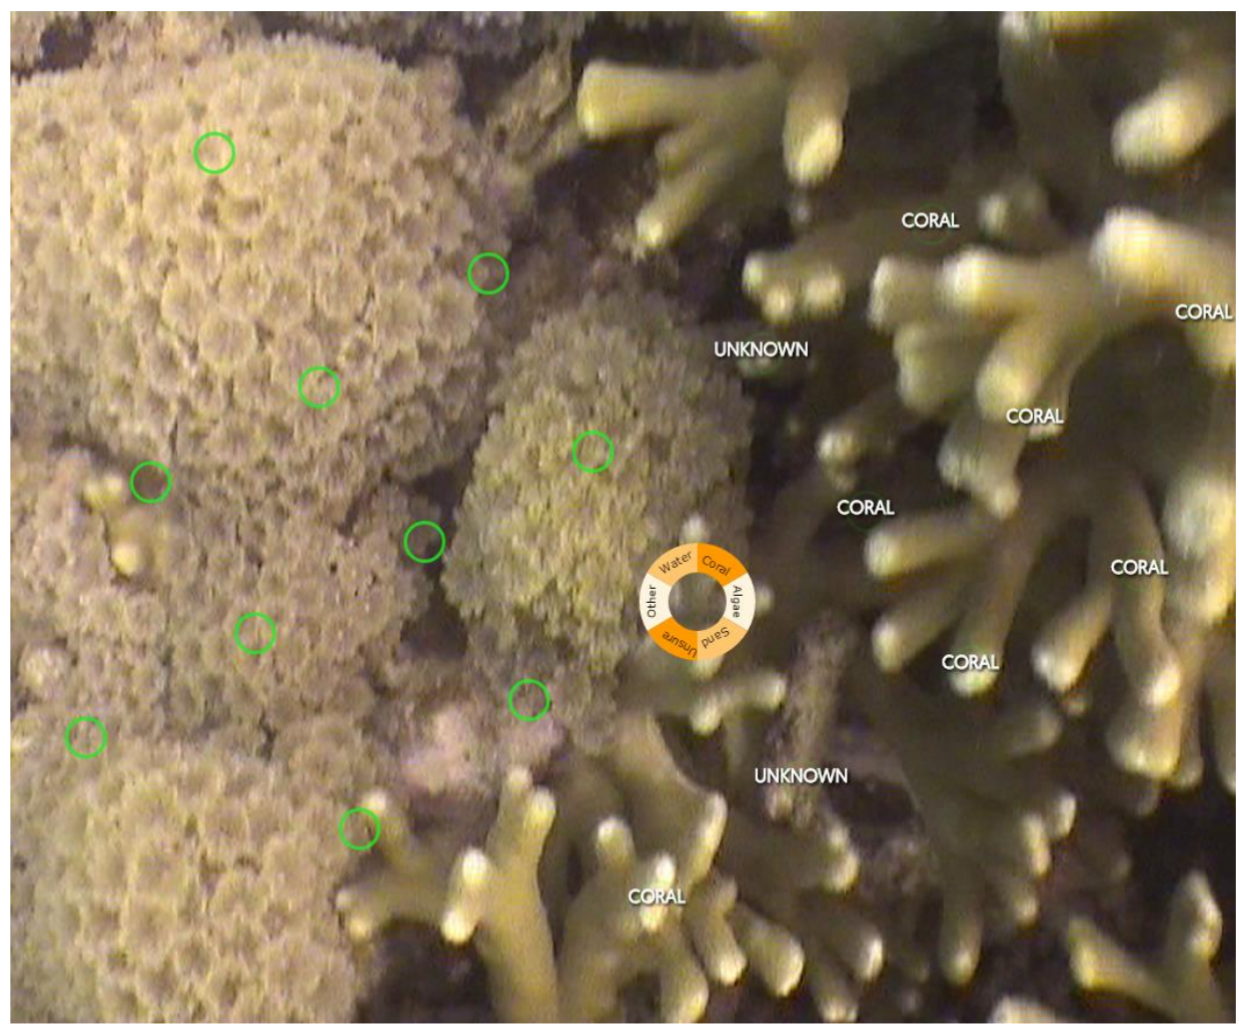
The VRD application enables citizen scientists to contribute to the new map in two ways: by identifying coral species in professional photos and contributing their own images, expanding the geographic reach of the image dataset.

Supporting coral recovery
Peterson said that coral communities support each other much the same way trees in a forest do. For anyone planning to seed Acropora, it is not enough that the coral spawn successfully, the mated egg and sperm cells still need a local web of same-species communities for a successful recruitment. The new predictive modeling map can identify these communities.
“This information is really important when it comes to reef interventions, such as genetically modified coral,” Peterson told Infrastructure Magazine. She was referring to a restoration plan put forth by the Australian Institute of Marine Science, which calls for “next generation corals for tomorrow’s reefs such as translocating existing corals with elevated temperature resistance, selective breeding and gene modification.”
“We can’t plant coral larvae everywhere,” Peterson said, “but we can seed reefs that are strongly connected to other reefs through ocean circulation. With traditional resources, we don’t have a good idea of overall coral cover, which you need to carry out genetic connectivity modeling.”
The approach by Peterson and colleagues can map not only coral cover, but also environmental features such as water temperature, history of high-impact events like cyclones, or the presence of marine predators like the crown-of-thorns starfish.
Datasets with different levels of accuracy can affect the model’s ability to predict coral cover, so the researchers applied a weighting system. Statistics predicting probabilities enable the team to understand and model how much all those datasets vary.
“The model weights the contribution of different datasets and allows using data from different providers at once, professional and citizens and artificial intelligence, to help make a robust picture of the condition of coral reefs across very large scales,” González-Rivero said.
For example, they tested the ability of individual citizen scientists working with Virtual Reef Diver to accurately identify coral by having volunteers classify (annotate) images from known datasets. Each citizen’s input was then weighted according to its accuracy.
“Tools like the Virtual Reef Diver can help gather citizen science annotations and test their contribution,” González-Rivero said, “to assist the training of more informative artificial intelligence algorithms.”

VRD has been able to confirm proof of concept and will give citizen scientists a sense of empowerment.
“With simple modifications to the mobile app,” Peterson said, “images collected by hundreds of Eye on the Reef volunteers can be automatically uploaded to the VRD platform for analysis.”
“Participants can see their data in VRD, learn how it is used, and understand how their efforts help inform management,” she added.
Image data for coral assessments
The new modeling approach mines images in a unique way.
“Images were used as objects for classification and to analyze the characteristics contained in groups of pixels (e.g., color, texture, shading),” González-Rivero said. “Because images can be quickly taken while diving, they allow us scientists to collect a large volume of information, covering large areas.”
“Traditionally, random points are laid on an image as objects for classification, where an expert or citizen scientist annotates the identity of the organism behind each point,” he added. “A second approach was used by the data provided by the 2014 XL Catlin Seaview Survey, where machine learning algorithms … were able to accurately identify the benthic organism behind the points on the images using millions of attributes derived from the information contained in the pixels.”

Integrating both sets of data yielded more accuracy to the predictions.
“Ultimately, both our human brains and the machine algorithms make use of the texture, shading, shape and colors to identify what’s on an image,” González-Rivero said, “although perhaps in different ways.”
But will all this help Acropora?
The versatility of Peterson’s model says yes. “Predictive maps also can be used for other research purposes,” she said, “such as connectivity modeling to identify optimal larval restoration sites.”
In April, the GBRMPA teamed up with the University of Queensland to map the entire GBR using remote sensing via satellite spectral imaging. The map will be able to catalog species up to 10 meters below the ocean surface. But for deeper reefs – outer reefs can reach 2,000 meters in depth – only cameras can capture the needed resolution.
“It’s difficult [for satellites] to discriminate between live and dead coral, algae and sand in most cases,” Peterson said, “especially as the depth and turbidity of water increases. That’s why most estimates of coral cover come from underwater images.”
“Mapping the entire GBR requires a combined approach between underwater and satellite observations,” said González-Rivero. “These are exciting times for coral reef conservation in the GBR and multiple projects are looking at increasing our knowledge across the entire GBR, including using satellites, citizen participation, expert observations and machine learning algorithms.”
Citation
Peterson, Erin E…Manuel González-Rivero, et al. (2018). “Monitoring through many eyes: Integrating disparate datasets to improve monitoring of the Great Barrier Reef.” https://arxiv.org/pdf/1808.05298.pdf
FEEDBACK: Use this form to send a message to the editor of this post. If you want to post a public comment, you can do that at the bottom of the page.


