Ohio Valley, California have highest levels of carbon dioxide
Ohio Valley, California have highest levels of carbon dioxide
mongabay.com
January 22, 2007
The Ohio Valley and California have the high levels of carbon dioxide produced by fossil fuels combustion, while Colorado has the least, found a new study published in the January 23rd issue of Geophysical Research Letters, a journal of the American Geophysical Union.
Researchers led by Diana Hsueh at the University of California, Irvine (UCI), used corn to measure carbon dioxide levels. A news release from the American Geophysical Union explains:
-
The scientists chose corn, because it is widely grown and, as an annual plant, all of its carbon is derived from a single growing season. They avoided pollution point sources, such as highways and power plants, to allow for mapping of regional patterns across various states and provinces. In the laboratory, they dried samples of corn leaves and husks and chemically converted them into graphite. They then analyzed the graphite in a mass spectrometer, which measured levels of radiocarbon, a rare isotope of carbon.
Carbon dioxide derived from fossil fuels contains no radiocarbon, so it is easily distinguishable from other sources. With measurements from the mass spectrometer, the scientists calculated overall levels of carbon dioxide produced by fossil fuels at the locations where the corn samples were collected.

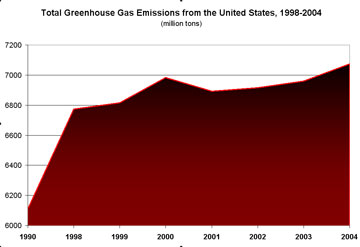
10 highest carbon dioxide emissions in 2001: Texas (656 million metric tons), California (383), Pennsylvania (262), Ohio (252), Florida (239), Indiana (230), Illinois (227), New York (212), Michigan (181), and Louisiana (165). |
The results showed that the Rocky Mountains appear to be a barrier against eastward drift of carbon dioxide from California, with air in the “Mountain West,” including Colorado, Idaho, and New Mexico, having the lowest carbon dioxide levels of about 370 parts per million (ppm). Air content of carbon dioxide from fossil fuel sources was measured at 640 ppm in Massachusetts, New Hampshire, and New York, while “air in Maryland, Ohio, Pennsylvania, and West Virginia had nearly twice as much additional carbon dioxide from fossil fuels,” according to AGU. For comparison, atmospheric concentrations of carbon dioxide currently stand at 381 ppm.
“Many nations are facing increasing pressure to monitor and regulate the release of carbon dioxide from fossil fuel sources to limit greenhouse gas warming,” said James Randerson, associate professor of Earth system science and a co-author of the study. “This method can help determine how much fossil fuel carbon dioxide is coming from different regions.”
“We have to better understand emission patterns and changes in the atmosphere in order to better regulate fossil fuels,” said Susan Trumbore, professor of Earth system science at UCI. “This is a direct way to measure the release of carbon dioxide emissions that are contributing to climate warming.”
Citation: Hsueh, D. Y., N. Y. Krakauer, J. T. Randerson, X. Xu, S. E. Trumbore, and J. R. Southon (2007), Regional patterns of
radiocarbon and fossil fuel-derived CO2 in surface air across North America, Geophysical Research Letters, 34, L02816, doi:10.1029/2006GL027.
This article is based on news release from the American Geophysical Union.


