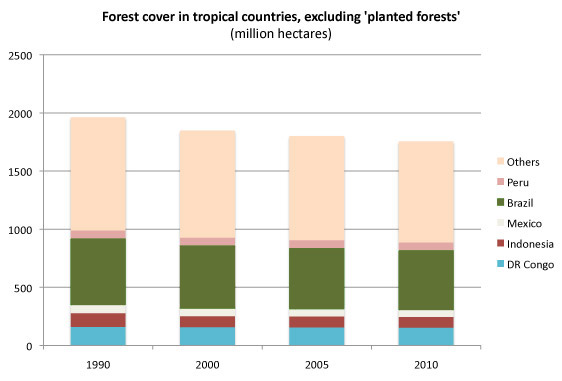
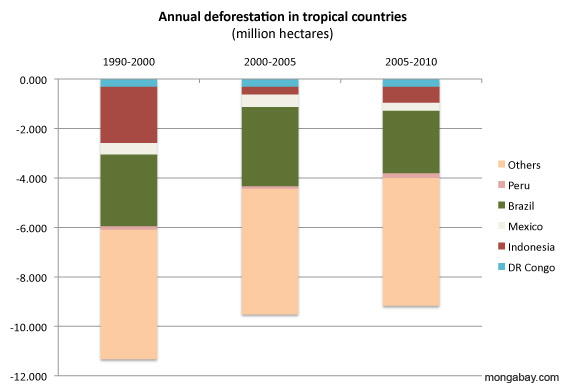
Deforestation rates in tropical countries dropped significantly during the first decade of the 21st century relative to the 1990s, reveals new data released by the Food and Agriculture Organization of the United Nations (FAO).
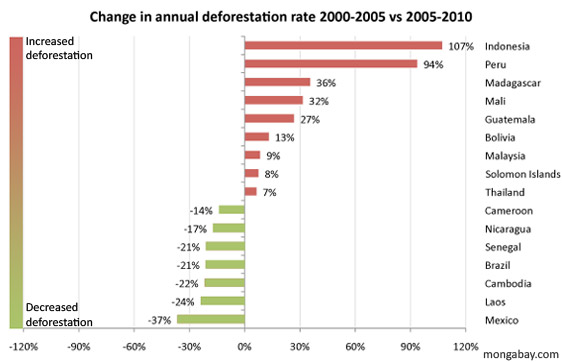
FAO figures show deforestation across 121 tropical countries averaged 9.34 million hectares per year between 2000 and 2010, down from 11.33 million hectares per year in the 1990s. The decline has accelerated since 2005 due Brazil’s dramatic reduction of deforestation in the Brazilian Amazon, which peaked at 27,772 square kilometers in 2004 but is expected to come in at less than 8,000 for 2010. Overall Brazil’s reduction in deforestation since 2005—which fell from 3.2 million hectares per year from 2000-2005 to 2.5 million hectares in 2005-2010—more than offset increases in forest clearing in other major forest countries including Indonesia (107 percent increase), Peru (94 percent), and Madagascar (36 percent) during the period.

Other major countries that showed sharp reductions in deforestation between the first half of the decade and the second half of the decade include Mexico (37 percent drop), Laos (24 percent), Cambodia (22 percent), and Cameroon (14 percent).
FAO estimates global deforestation fell from 16 million hectares per year in the 1990s to 13 million hectares per year in the past decade. Factoring in planted forests, the loss of forest cover fell from 8.3 million hectares per year to 5.2 million hectares, an area about the size of Costa Rica.

But primary forest, the most carbon-dense and biologically diverse form of forest, declined by more than 40 million hectares over the past decade, primarily a result of first-time logging. Logging of primary forest does not necessarily result in deforestation, but does register a change under FAO’s classification system. After Nigeria, which has almost no remaining old growth forest, South Korea had the highest annual rate of primary forest loss at nearly 4 percent per year over the past five years.

| Forest cover (excluding planted forests) | Annual change | ||||||
| 1000 ha | 1000 ha | 1000 ha | 1000 ha | 1000 ha | 1000 ha | ||
| 1990 | 2000 | 2005 | 2010 | 2000-2005 | 2005-2010 | change in rate | |
| Angola | 60836 | 59594 | 58973 | 58352 | -124.2 | -124.2 | – |
| Benin | 5751 | 5048 | 4796 | 4542 | -50.4 | -50.8 | 0.8% |
| Bhutan | 3034 | 3139 | 3193 | 3246 | 10.8 | 10.6 | -1.9% |
| Bolivia | 62775 | 60071 | 58714 | 57176 | -271.4 | -307.6 | 13.3% |
| Brazil | 569855 | 540767 | 524729 | 512104 | -3207.6 | -2525 | -21.3% |
| Burkina Faso | 6840 | 6190 | 5871 | 5540 | -63.8 | -66.2 | 3.8% |
| Cambodia | 12877 | 11467 | 10657 | 10025 | -162 | -126.4 | -22.0% |
| Cameroon | 24316 | 22116 | 20932 | 19916 | -236.8 | -203.2 | -14.2% |
| Central African Republic | 23201 | 22901 | 22753 | 22603 | -29.6 | -30 | 1.4% |
| Chad | 13099 | 12303 | 11906 | 11508 | -79.4 | -79.6 | 0.3% |
| Colombia | 62382 | 61254 | 60674 | 60094 | -116 | -116 | – |
| Congo | 22675 | 22505 | 22420 | 22336 | -17 | -16.8 | -1.2% |
| Costa Rica | 2269 | 2173 | 2269 | 2364 | 19.2 | 19 | -1.0% |
| Côte d’Ivoire | 10068 | 10067 | 10068 | 10066 | 0.2 | -0.4 | N/A |
| Cuba | 1711 | 2093 | 2309 | 2384 | 43.2 | 15 | -65.3% |
| DR Congo | 160307 | 157192 | 155635 | 154076 | -311.4 | -311.8 | 0.1% |
| Ecuador | 13817 | 11680 | 10688 | 9698 | -198.4 | -198 | -0.2% |
| Ethiopia | 14623 | 13214 | 12509 | 11785 | -141 | -144.8 | 2.7% |
| French Guiana | 8187 | 8117 | 8099 | 8081 | -3.6 | -3.6 | – |
| Gabon | 21970 | 21970 | 21970 | 21970 | 0 | 0 | – |
| Ghana | 7398 | 6034 | 5357 | 4680 | -135.4 | -135.4 | – |
| Guatemala | 4697 | 4115 | 3837 | 3484 | -55.6 | -70.6 | 27.0% |
| Guinea | 7204 | 6832 | 6642 | 6451 | -38 | -38.2 | 0.5% |
| Guinea-Bissau | 2216 | 2120 | 2071 | 2021 | -9.8 | -10 | 2.0% |
| Guyana | 15205 | 15205 | 15205 | 15205 | 0 | 0 | – |
| Honduras | 8136 | 6392 | 5792 | 5192 | -120 | -120 | – |
| India | 58223 | 58223 | 58223 | 58223 | 0 | 0 | – |
| Indonesia | 118545 | 95737 | 94158 | 90883 | -315.8 | -655 | 107.4% |
| Kenya | 3470 | 3370 | 3320 | 3270 | -10 | -10 | – |
| Laos | 17311 | 16433 | 15918 | 15527 | -103 | -78.2 | -24.1% |
| Liberia | 4921 | 4621 | 4471 | 4321 | -30 | -30 | – |
| Madagascar | 13461 | 12850 | 12548 | 12138 | -60.4 | -82 | 35.8% |
| Malawi | 3764 | 3370 | 3117 | 2872 | -50.6 | -49 | -3.2% |
| Malaysia | 20420 | 19932 | 19317 | 18649 | -123 | -133.6 | 8.6% |
| Mali | 14067 | 13226 | 12680 | 11960 | -109.2 | -144 | 31.9% |
| Mexico | 70291 | 65693 | 63184 | 61599 | -501.8 | -317 | -36.8% |
| Mozambique | 43340 | 41150 | 40055 | 38960 | -219 | -219 | – |
| Myanmar | 38824 | 34172 | 32472 | 30785 | -340 | -337.4 | -0.8% |
| Nepal | 4777 | 3858 | 3593 | 3593 | -53 | 0 | -10.0% |
| Nicaragua | 4514 | 3814 | 3390 | 3040 | -84.8 | -70 | -17.5% |
| Nigeria | 16983 | 12821 | 10740 | 8659 | -416.2 | -416.2 | – |
| Panama | 3779 | 3325 | 3248 | 3172 | -15.4 | -15.2 | -1.3% |
| Papua New Guinea | 31460 | 30051 | 29345 | 28640 | -141.2 | -141 | -0.1% |
| Paraguay | 21134 | 19332 | 18432 | 17534 | -180 | -179.6 | -0.2% |
| Peru | 69893 | 68498 | 67988 | 66999 | -102 | -197.8 | 93.9% |
| Philippines | 6268 | 6790 | 7051 | 7313 | 52.2 | 52.4 | 0.4% |
| Senegal | 9143 | 8592 | 8266 | 8009 | -65.2 | -51.4 | -21.2% |
| Sierra Leone | 3111 | 2914 | 2813 | 2711 | -20.2 | -20.4 | 1.0% |
| Solomon Islands | 2280 | 2240 | 2214 | 2186 | -5.2 | -5.6 | 7.7% |
| Suriname | 14763 | 14763 | 14763 | 14745 | 0 | -3.6 | – |
| Tanzania | 41345 | 37262 | 35215 | 33188 | -409.4 | -405.4 | -1.0% |
| Thailand | 16881 | 15893 | 15454 | 14986 | -87.8 | -93.6 | 6.6% |
| Uganda | 4717 | 3837 | 3398 | 2937 | -87.8 | -92.2 | 5.0% |
| Venezuela | 52026 | 49151 | 47713 | 46275 | -287.6 | -287.6 | – |
| Viet Nam | 8396 | 9675 | 10283 | 10285 | 121.6 | 0.4 | -99.7% |
| Zambia | 52740 | 51074 | 50241 | 49406 | -166.6 | -167 | 0.2% |
| Zimbabwe | 22010 | 18774 | 17151 | 15516 | -324.6 | -327 | 0.7% |
Note: FAO data is based largely on self-reporting by countries. So countries lack adequate systems for tracking changes in forest cover.
Global Forest Resources Assessment 2010
Related articles

Loss of old growth forest continues
(10/06/2010) A new global assessment of forest stocks by the U.N. Food and Agriculture Organization (FAO) shows continuing loss of primary forests since 2005 despite gains in the extent of protected areas. FAO’s Global Forest Resources Assessment 2010 reveals some 13 million hectares of forest were cleared between 2000 and 2010, down from around 16 million hectares per year during the 1990s. Loss of primary forest—mostly a consequence of logging—averaged 4.2 million hectares per year, down from 4.7 million hectares per year in the 1990s.
Amazon deforestation falls significantly in 2010, according to preliminary data

(08/31/2010) Deforestation in the Brazilian Amazon is down significantly since last year, according to preliminary estimates released by Brazil’s National Institute for Space Research (INPE) and Imazon, a Brazil-based NGO that tracks forest loss and degradation across the Amazon. Analysis of NASA MODIS data by Imazon found some 1,488 square kilometers of forest were cleared during the 12 months ended July 31, 2010, down 16 percent from the same period last year, when 1,766 square kilometers were deforested. Meanwhile analysis by INPE shows an even steeper drop from 4,375 square kilometers in August 2008 through July 2009 to 2,296 square kilometers in the current period, a decline of 48 percent. The discrepancy between INPE’s and Imazon’s estimates results from differences in how deforestation is tracked.
Destruction of old-growth forests looms over climate talks

(12/08/2009) Destruction of old-growth or primary forests looms large in discussions in Copenhagen over a scheme to compensate tropical countries for reducing emissions from deforestation and degradation (REDD). Some environmental groups are pressing for conservation of old-growth forests — the most carbon-dense, and biologically-rich state of forests — to be the centerpiece of REDD, while industry and other actors are pushing for “sustainable forest management” or logging using reduced-impact techniques to be the primary focus of REDD.


