Forest loss in Indonesia has sharply risen over the past 12 years, reports a new study published in the journal Science.
The study, led by Matt Hansen of University of Maryland, finds that Indonesia lost 15.8 million hectares between 2000 and 2012, ranking it fifth behind Russia, Brazil, the United States, and Canada in terms of forest loss. Some 7 million hectares of forest regrew during the period.
But of the top five forest countries, Indonesia had by far the highest percentage rate of forest loss at 8.4 percent. By comparison, Brazil lost only half as much on a proportional basis.

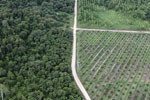
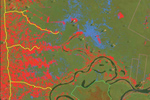
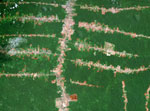
98 percent of the archipelago’s forest loss occurred in dense forest areas in Sumatra and Kalimantan (Indonesian Borneo), where industrial tree plantations and oil palm estates have rapidly proliferated over the past 20 years. Riau Province was particularly hard hit, as an animation released by the authors shows:

Deforestation is also on the rise in the country. In 2011/2012 forest loss reached the highest level since the late 1990’s despite a nationwide ban on new concessions in 65 million hectares of primary forest areas, peatlands, and protected areas. The data suggests the forestry moratorium, which was implemented as part of the country’s commitment to reduce emissions from deforestation and forest degradation, may be failing to deliver as hoped.

The results are a stark contrast to numbers released earlier this year by Indonesia’s Ministry of Forestry, which claimed that deforestation has fallen on an annual basis since 2005/2006. But the difference between the estimates could be partly methodological — the Ministry of Forestry estimate ignores deforestation on land outside the area it manages and excludes conversion of natural forest to timber plantations, which are classified as “forest.”
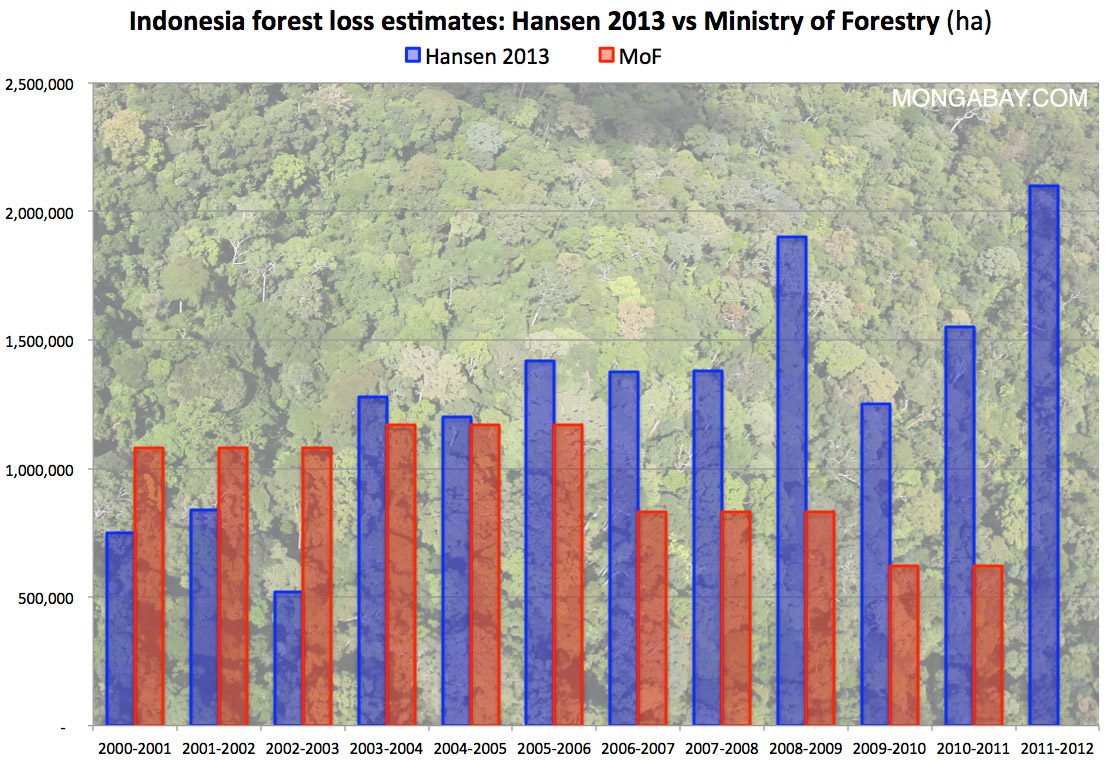
Note: Hansen et al’s data includes all “forest cover” including plantations and natural forests, while MoF data only incorporates change in forest cover within Indonesia’s Forest Estate, a zone managed by MoF. Hansen’s “forest loss” data would thus include replanting of timber and oil palm plantations.
The new data, which is based on the rendering of 650,000 NASA Landsat images by Google Earth Engine, a computing cloud run by the Internet giant, is published as a comprehensive database represented as an interactive global forest map. The tool is freely available at earthenginepartners.appspot.com/science-2013-global-forest.

Clarifying Google’s forest map |
Hansen, who has published a number of papers on deforestation trends, says he hopes the map can help countries develop better policies for reducing forest loss.
“This is the first map of forest change that is globally consistent and locally relevant,” Hansen said in a statement. “Brazil used Landsat data to document its deforestation trends, then used this information in its policy formulation and implementation. They also shared these data, allowing others to assess and confirm their success.”
“Such data have not been generically available for other parts of the world. Now, with our global mapping of forest changes every nation has access to this kind of information, for their own country and the rest of the world.”


CITATION:
- Matt Hansen et al. High-Resolution Global Maps of 21st-Century Forest Cover Change. SCIENCE VOL 342 15 NOVEMBER 2013
Related articles
Zero net deforestation is the wrong target, warn experts
(11/14/2013) Environmental initiatives that target zero net deforestation may miss their mark when it comes to slowing climate change and protecting biodiversity, warns a commentary published in this week’s issue of the journal Science. While zero net deforestation may seem like a worthy target in efforts to curb forest loss, Sandra Brown and Daniel Zarin argue that the goal is at best, ambiguous, and at worst, may lead to perverse outcomes for the world’s forests.
Powered by Google, high resolution forest map reveals massive deforestation worldwide

(11/14/2013) Researchers today released a long-awaited tool that reveals the extent of forest cover loss and gain on a global scale. Powered by Google’s massive computing cloud, the interactive forest map establishes a new baseline for measuring deforestation and forest recovery across all of the world’s countries, biomes, and forest types. The map has far-reaching implications for efforts to slow deforestation, which accounts for roughly ten percent of greenhouse gas emissions produced by human activities, according to the authors of the paper that describes the tool and details its first findings.
Conservation gets boost from new Landsat satellite
(04/03/2013) Efforts to monitor the world’s forests and other ecosystems got a big boost in February with the launch of Landsat 8, NASA’s newest earth observation satellite, which augments the crippled Landsat 7 currently orbiting Earth (technically Landsat 8 is still named the Landsat Data Continuity Mission (LDCM) and will remain so until May when the USGS turns control of the satellite over to NASA). Landsat 8/LDCM is the most advanced Earth observation satellite to date. It is the eighth Landsat since the initial launch in 1972.
Charts: deforestation in Indonesia and Malaysia, 2000-2010
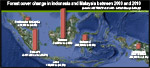
(07/15/2012) Indonesia and Malaysia lost more than 11 million hectares (42,470 square miles) of forest between 2000 and 2010, according to a study published last year in the journal Global Change Biology. The area is roughly the size of Denmark or the state of Virginia. The bulk of forest loss occurred in lowland forests, which declined by 7.8 million hectares or 11 percent on 2000 cover. Peat swamp forests lost the highest percentage of cover, declining 19.7 percent. Lowland forests have historically been first targeted by loggers before being converted for agriculture. Peatlands are increasingly converted for industrial oil palm estates and pulp and paper plantations.
Indonesia, Brazil, Mexico, Peru get big boost in deforestation tracking, biomass measurement
(07/11/2012) Efforts to rapidly and accurately track deforestation and forest degradation in Indonesia, Brazil, Mexico, and Peru got a boost this week with a special technical training session organized by the Governors Climate and Forest Task Force. The meeting, convened at Stanford University and Google’s Silicon Valley campus, paired staffers from government agencies and NGOs in the four tropical countries with technical experts from the Amazon Environmental Research Institute (IPAM), the Carnegie Institution for Science, the Forum on Readiness for REDD, Woods Hole Research Center, and Google Earth Outreach. The participants received training to augment existing deforestation, forest degradation and biomass monitoring capabilities, which are highly variable both between countries and within sub-national agencies and jurisdictions.
New Google Earth tool maps deforestation, threatened forests in Sumatra
(05/24/2012) The World Wildlife Fund (WWF) and a coalition of Indonesian environmental groups known as Eyes on the Forest have released a new Google Earth-based tool that maps forests, land use, carbon stocks, and biodiversity across the Indonesian island of Sumatra.

(07/27/2011) Indonesia’s forests were cleared at a rate of 1.5 million hectares per year between 2000 and 2009, reports a new satellite-based assessment by Forest Watch Indonesia (FWI), an NGO. Expansion of oil palm and wood-pulp plantations were the biggest drivers of deforestation, yet account for a declining share of the national economy. The study, which compared year 2000 data with 2009 Landsat images from NASA, found that Indonesia’s forest cover declined from 103.32 million hectares to 88.17 million hectares in ten years. Since 1950 Indonesia lost more than 46 percent of its forests.
Will Indonesia’s big REDD rainforest deal work?
(12/28/2010) Flying in a plane over the Indonesian half of the island of New Guinea, rainforest stretches like a sea of green, broken only by rugged mountain ranges and winding rivers. The broccoli-like canopy shows little sign of human influence. But as you near Jayapura, the provincial capital of Papua, the tree cover becomes patchier—a sign of logging—and red scars from mining appear before giving way to the monotonous dark green of oil palm plantations and finally grasslands and urban areas. The scene is not unique to Indonesian New Guinea; it has been repeated across the world’s largest archipelago for decades, partly a consequence of agricultural expansion by small farmers, but increasingly a product of extractive industries, especially the logging, plantation, and mining sectors. Papua, in fact, is Indonesia’s last frontier and therefore represents two diverging options for the country’s development path: continued deforestation and degradation of forests under a business-as-usual approach or a shift toward a fundamentally different and unproven model based on greater transparency and careful stewardship of its forest resources.
How satellites are used in conservation
(04/13/2009) In October 2008 scientists with the Royal Botanical Garden at Kew discovered a host of previously unknown species in a remote highland forest in Mozambique. The find was no accident: three years earlier, conservationist Julian Bayliss identified the site—Mount Mabu—using Google Earth, a tool that’s rapidly becoming a critical part of conservation efforts around the world. As the discovery in Mozambique suggests, remote sensing is being used for a bewildering array of applications, from monitoring sea ice to detecting deforestation to tracking wildlife. The number of uses grows as the technology matures and becomes more widely available. Google Earth may represent a critical point, bringing the power of remote sensing to the masses and allowing anyone with an Internet connection to attach data to a geographic representation of Earth.
Development of Google Earth a watershed moment for the environment
(03/31/2009) Satellites have long been used to detect and monitor environmental change, but capabilities have vastly improved since the early 1970s when Landsat images were first revealed to the public. Today Google Earth has democratized the availability of satellite imagery, putting high resolution images of the planet within reach of anyone with access to the Internet. In the process, Google Earth has emerged as potent tool for conservation, allowing scientists, activists, and even the general public to create compelling presentations that reach and engage the masses. One of the more prolific developers of Google Earth conservation applications is David Tryse. Neither a scientist nor a formal conservationist, Tryse’s concern for the welfare of the planet led him develop a KML for the Zoological Society of London’s EDGE of Existence program, an initiative to promote awareness of and generating conservation funding for 100 of the world’s rarest species. The KML allows people to surf the planet to see photos of endangered species, information about their habitat, and the threats they face. Tryse has since developed a deforestation tracking application, a KML that highlights hydroelectric threats to Borneo’s rivers, and oil spills and is working on a new tool that will make it even easier for people to create visualizations on Google Earth. Tryse believes the development of Google Earth is a watershed moment for conservation and the environmental movement.