China imported $6.1 billion worth of logs in 2010, a 22.4 percent increase over 2009, according to the country’s customs bureau.
Russia dominated the trade, accounting for 41 percent by volume and 30 percent by value. New Zealand (17.3 percent and 13.1 percent, respectively) and the United States (8.1 percent and 9.6 percent) were second and third by volume and value.
Among tropical countries, Papua New Guinea was the largest supplier of logs to China. It sent 2.5 million cubic meters of wood worth 478 million. It was followed by the Solomon Islands, Malaysia, Gabon, and Republic of Congo.
Sawnwood imports jumped 49 percent in volume and 67 in value over 2009. Russia, Canada, and the U.S. accounted for more than two-thirds of sawnwood volume and 57.4 percent of value.
Meanwhile 34 percent of China’s wood furniture exports (by value) ended up in the United States. Just under 7 percent went to the U.K. China’s wood furniture export market was worth $16.2 billion in 2010.
The timber import and furniture export data was reported in the April 30, 2011 issue of the ITTO Tropical Timber Market Report.
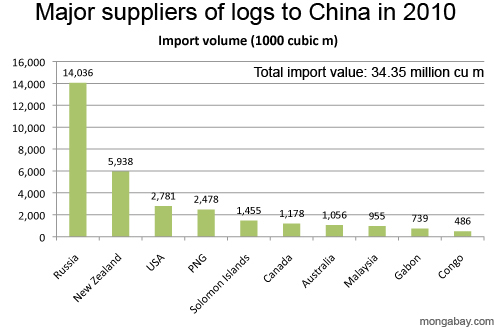
Major suppliers of logs to China in 2010
| Country | Import volume (1000 cubic m) |
Proportion (%) | Change |
| Russia | 14,036 | 40.9 | -5.2 |
| New Zealand | 5,938 | 17.3 | 34.6 |
| USA | 2,781 | 8.1 | 266.2 |
| PNG | 2,478 | 7.2 | 49.3 |
| Solomon Islands | 1,455 | 4.2 | 29.4 |
| Canada | 1,178 | 3.4 | 216.8 |
| Australia | 1,056 | 3.1 | 44.3 |
| Malaysia | 955 | 2.8 | 32.4 |
| Gabon | 739 | 2.2 | -32.2 |
| Congo | 486 | 1.4 | 11.3 |
| Total | 34,348 | 100 | 22.4 |
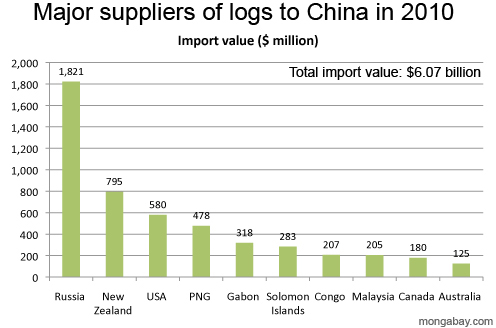
Major suppliers of logs to China in 2010
| Country | Import value ($ million) |
Proportion (%) | Change |
| Russia | 1,821 | 30 | 4.8 |
| New Zealand | 795 | 13.1 | 85.8 |
| USA | 580 | 9.6 | 245.2 |
| PNG | 478 | 7.9 | 73.8 |
| Gabon | 318 | 5.2 | 39.4 |
| Solomon Islands | 283 | 4.7 | 61.7 |
| Congo | 207 | 3.4 | 158.3 |
| Malaysia | 205 | 3.4 | 60.2 |
| Canada | 180 | 3 | 253 |
| Australia | 125 | 2.1 | 92.3 |
| Total | 6,071 | 100 | 48.6 |
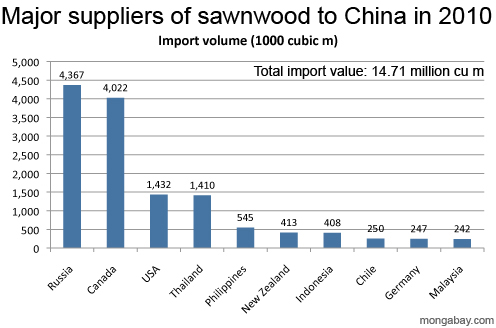
Major suppliers of sawnwood to China in 2010
| Country | Import volume (1000 cubic m) |
Proportion (%) | Change (%) |
| Russia | 4,367 | 29.7 | 40 |
| Canada | 4,022 | 27.3 | 65 |
| USA | 1,432 | 9.7 | 54.2 |
| Thailand | 1,410 | 9.6 | 37.6 |
| Philippines | 545 | 3.7 | 85.4 |
| New Zealand | 413 | 2.8 | -1.2 |
| Indonesia | 408 | 2.8 | 92 |
| Chile | 250 | 1.7 | 25.7 |
| Germany | 247 | 1.7 | |
| Malaysia | 242 | 1.7 | 18.4 |
| Total | 14,711 | 100 | 48.8 |
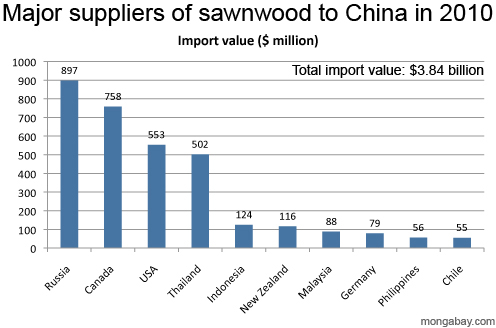
Major suppliers of sawnwood to China in 2010
| Country | Import value ($ million) |
Proportion (%) | Change (%) |
| Russia | 897 | 23.3 | 49.8 |
| Canada | 758 | 19.7 | 108.2 |
| USA | 553 | 14.4 | 77.8 |
| Thailand | 502 | 13.1 | 71.9 |
| Indonesia | 124 | 3.2 | 93.8 |
| New Zealand | 116 | 3 | 18.4 |
| Malaysia | 88 | 2.3 | 37.5 |
| Germany | 79 | 2.1 | |
| Philippines | 56 | 1.5 | 100 |
| Chile | 55 | 1.4 | 44.7 |
| Total | 3,843 | 100 | 65.7 |
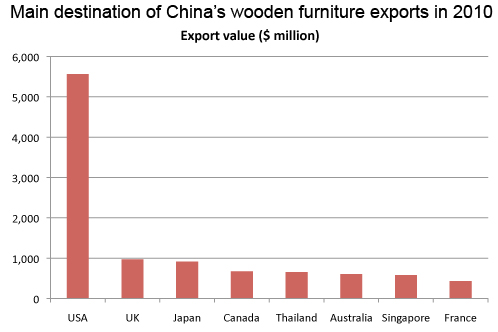
Main destination of China’s wooden furniture exports in 2010
| Country | Export value ($1,000) |
Change from 2009 (%) | Proportion (%) |
| USA | 5,560 | 30.6 | 34.4 |
| UK | 972 | 16.6 | 6.6 |
| Japan | 916 | 14.8 | 5.7 |
| Canada | 670 | 37.3 | 4.2 |
| Thailand | 653 | 480.2 | 4 |
| Australia | 602 | 16.3 | 3.7 |
| Singapore | 582 | -17.7 | 3.6 |
| France | 432 | 50.3 | 2.7 |
| Total-exports | 16,157 | 34.3 | 100 |
Related articles