More coverage: Rainforest loss slows
A new global assessment of forest stocks by the U.N. Food and Agriculture Organization (FAO) shows continuing loss of primary forests since 2005 despite gains in the extent of protected areas.
FAO’s Global Forest Resources Assessment 2010 reveals some 13 million hectares of forest were cleared between 2000 and 2010, down from around 16 million hectares per year during the 1990s. Loss of primary forest—mostly a consequence of logging—averaged 4.2 million hectares per year, down from 4.7 million hectares per year in the 1990s, but the figures exclude Canada, which doesn’t report any change in old growth forest cover despite being a major timber exporter.
 Click to enlarge |
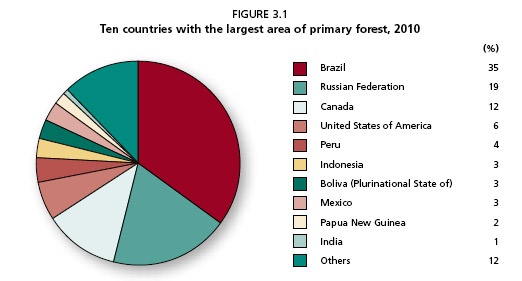
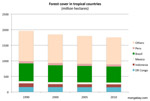
Among countries with significant primary forest cover, Nigeria had the fastest rate of loss (which does not neccessarily reflect dforestation, but can mean first time selective logging of old growth forest), approaching 20 percent per year from 2005 to 2010, followed by South Korea (3.95 percent per year), Malawi (3.77 percent), Guatemala (3.72 percent), Sierra Leone (3.21 percent), Central African Republic (2.94 percent), Gabon (2.16 percent), and Nicaragua (2.16 percent). Brazil led all countries in total primary forest loss during the 2005-2010 period, losing 2.3 million hectares per year. It was followed by Papua New Guinea (427,000 hectares per year) and Gabon (330,000 ha). Primary forests today account for 36 percent (1.4 billion ha) of the world’s forest area. 81 countries reported they have no remaining primary cover, although in some cases this may be due to a lack of data.
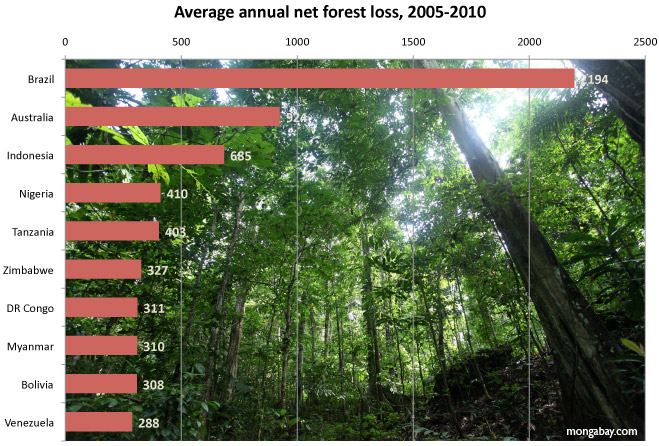
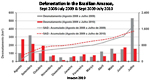
The FAO report shows that while deforestation slowed in the 2000s relative to the 1990s, forest loss accelerated during the second half of the decade, led by Brazil (2.19 million hectares per year), Australia (924,000 ha), Indonesia (685,000 ha), Nigeria (410,000 ha), and Tanzania (403,000 ha). But Brazil’s rate actually represents a reduction relative to the 2000-2005 period when 3.09 million hectares were lost per year.
The report estimates some 13 percent of the world’s forest area now lies in legally established protected areas. With nearly 89 million hectares under protection, Brazil leads the world in protecting forest areas.
Plantations
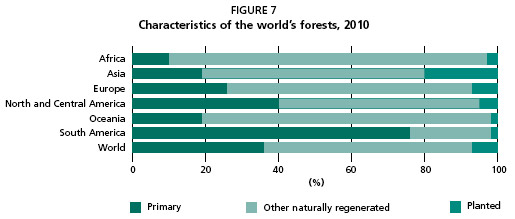
The FAO report finds that tree plantations continue to expand, helping offset the loss of natural forests. Temperate countries report the largest extent of planted forests, but China led the world in expansion over the past 20 years, planting an average of 1.9 million hectares of plantations per year. In the tropics, India reported the largest total increase in planted forest area (5 million hectares) over the past two decades. Oil palm plantation expansion in Indonesia and Malaysia was excluded from the estimates since FAO considers oil palm an agricultural crop, rather than a ‘planted forest’.
Socio-economic findings
FAO’s assessment finds that the forestry sector is generally a money-losing proposition for governments. Public expenditure on forestry averaged $7.50 per hectare worldwide, but exceeded $20 per hectare in Asia. Total forest revenue collection was about $4.50 per hectare globally. Forest management and conservation directly employs about 10 million people worldwide, although many more depend on forests for informal livelihoods. The total value of forest products was estimated at $122 billion for 2005. Timber accounted for 71 percent of the value, followed by non-wood forest products (15 percent) and fuelwood (14 percent). Industrial roundwood (logs) had an average value of $51 per cubic meter.
About 80 percent of the global forest area is publicly owned, while 18 percent is privately held.
 Logging of old-growth or primary forests is a hot-button issue for environmentalists. While selective logging can preserve most of the ecological functions and biodiversity of untouched forests, logged forests are more likely to eventually be cleared entirely for agriculture. Still, loss of primary forest does not necessarily reflect “deforestation”. |
Forest fires
FAO reports fire is significantly under-appreciated as a threat to forests. An average of 1 percent of forest cover was reported to be “significantly affected” each year by forest fires, but this figure likely represents a significant underestimate since many countries did not report data. More than 90 percent of fires are classified as wildlifes, rather than prescribed burns.
Forest Resources Assessment 2010
The Forest Resources Assessment 2010 contains data from 233 countries. More than 900 experts from 178 countries contributed to the report, which was four years in preparation.
While the FAO remains the standard for statistics on forest cover, the data collection process suffers from self-reporting: some countries report more accurately than others. FAO is working with partners on a global remote sensing survey of forests that will help better monitor changes in forest cover and land use. Furthermore, rising interest in the proposed reducing emissions from deforestation and degradation (REDD) mechanism, has sparked new independent efforts to track forests.
Forest cover data
| Country | Forest area | Forest area | Total forest cover | |||
| Change | ||||||
| 2010 | 1990 | 2000 | 2010 | 2010 vs 2000 | ||
| 1 000 ha | “% of land area” |
1000 ha | 1000 ha | 1000 ha | ||
| Angola | 58480 | 47 | 60976 | 59728 | 58480 | -2.09% |
| Botswana | 11351 | 20 | 13718 | 12535 | 11351 | -9.45% |
| Comoros | 3 | 2 | 12 | 8 | 3 | -62.50% |
| Djibouti | 6 | n.s. | 6 | 6 | 6 | 0.00% |
| Eritrea | 1532 | 15 | 1621 | 1576 | 1532 | -2.79% |
| Ethiopia | 12296 | 11 | 15114 | 13705 | 12296 | -10.28% |
| Kenya | 3467 | 6 | 3708 | 3582 | 3467 | -3.21% |
| Lesotho | 44 | 1 | 40 | 42 | 44 | 4.76% |
| Madagascar | 12553 | 22 | 13692 | 13122 | 12553 | -4.34% |
| Malawi | 3237 | 34 | 3896 | 3567 | 3237 | -9.25% |
| Mauritius | 35 | 17 | 39 | 39 | 35 | -10.26% |
| Mayotte | 14 | 37 | 18 | 16 | 14 | -12.50% |
| Mozambique | 39022 | 50 | 43378 | 41188 | 39022 | -5.26% |
| Namibia | 7290 | 9 | 8762 | 8032 | 7290 | -9.24% |
| Réunion | 88 | 35 | 87 | 87 | 88 | 1.15% |
| Seychelles | 41 | 88 | 41 | 41 | 41 | 0.00% |
| Somalia | 6747 | 11 | 8282 | 7515 | 6747 | -10.22% |
| South Africa | 9241 | 8 | 9241 | 9241 | 9241 | 0.00% |
| Swaziland | 563 | 33 | 472 | 518 | 563 | 8.69% |
| Uganda | 2988 | 15 | 4751 | 3869 | 2988 | -22.77% |
| Tanzania | 33428 | 38 | 41495 | 37462 | 33428 | -10.77% |
| Zambia | 49468 | 67 | 52800 | 51134 | 49468 | -3.26% |
| Zimbabwe | 15624 | 40 | 22164 | 18894 | 15624 | -17.31% |
| Eastern and Southern Africa | 267517 | 27 | 304312 | 285906 | 267517 | -6.43% |
| Algeria | 1492 | 1 | 1667 | 1579 | 1492 | -5.51% |
| Egypt | 70 | n.s. | 44 | 59 | 70 | 18.64% |
| Libyan Arab Jamahiriya | 217 | n.s. | 217 | 217 | 217 | 0.00% |
| Mauritania | 242 | n.s. | 415 | 317 | 242 | -23.66% |
| Morocco | 5131 | 11 | 5049 | 5017 | 5131 | 2.27% |
| Sudan | 69949 | 29 | 76381 | 70491 | 69949 | -0.77% |
| Tunisia | 1006 | 6 | 643 | 837 | 1006 | 20.19% |
| Western Sahara | 707 | 3 | 707 | 707 | 707 | 0.00% |
| Northern Africa | 78814 | 8 | 85123 | 79224 | 78814 | -0.52% |
| Benin | 4561 | 41 | 5761 | 5061 | 4561 | -9.88% |
| Burkina Faso | 5649 | 21 | 6847 | 6248 | 5649 | -9.59% |
| Burundi | 172 | 7 | 289 | 198 | 172 | -13.13% |
| Cameroon | 19916 | 42 | 24316 | 22116 | 19916 | -9.95% |
| Cape Verde | 85 | 21 | 58 | 82 | 85 | 3.66% |
| Central African Republic | 22605 | 36 | 23203 | 22903 | 22605 | -1.30% |
| Chad | 11525 | 9 | 13110 | 12317 | 11525 | -6.43% |
| Congo | 22411 | 66 | 22726 | 22556 | 22411 | -0.64% |
| Côte d’Ivoire | 10403 | 33 | 10222 | 10328 | 10403 | 0.73% |
| Democratic Republic of the Congo | 154135 | 68 | 160363 | 157249 | 154135 | -1.98% |
| Equatorial Guinea | 1626 | 58 | 1860 | 1743 | 1626 | -6.71% |
| Gabon | 22000 | 85 | 22000 | 22000 | 22000 | 0.00% |
| Gambia | 480 | 48 | 442 | 461 | 480 | 4.12% |
| Ghana | 4940 | 22 | 7448 | 6094 | 4940 | -18.94% |
| Guinea | 6544 | 27 | 7264 | 6904 | 6544 | -5.21% |
| Guinea-Bissau | 2022 | 72 | 2216 | 2120 | 2022 | -4.62% |
| Liberia | 4329 | 45 | 4929 | 4629 | 4329 | -6.48% |
| Mali | 12490 | 10 | 14072 | 13281 | 12490 | -5.96% |
| Niger | 1204 | 1 | 1945 | 1328 | 1204 | -9.34% |
| Nigeria | 9041 | 10 | 17234 | 13137 | 9041 | -31.18% |
| Rwanda | 435 | 18 | 318 | 344 | 435 | 26.45% |
| Saint Helena, Ascension and Tristan da Cunha | 2 | 6 | 2 | 2 | 2 | 0.00% |
| Sao Tome and Principe | 27 | 28 | 27 | 27 | 27 | 0.00% |
| Senegal | 8473 | 44 | 9348 | 8898 | 8473 | -4.78% |
| Sierra Leone | 2726 | 38 | 3118 | 2922 | 2726 | -6.71% |
| Togo | 287 | 5 | 685 | 486 | 287 | -40.95% |
| Western and Central Africa | 328088 | 32 | 359803 | 343434 | 328088 | -4.47% |
| Africa | 674419 | 23 | 749238 | 708564 | 674419 | -4.82% |
| China | 206861 | 22 | 157141 | 177000 | 206861 | 16.87% |
| Democratic People’s Republic of Korea | 5666 | 47 | 8201 | 6933 | 5666 | -18.27% |
| Japan | 24979 | 69 | 24950 | 24876 | 24979 | 0.41% |
| Mongolia | 10898 | 7 | 12536 | 11717 | 10898 | -6.99% |
| Republic of Korea | 6222 | 63 | 6370 | 6288 | 6222 | -1.05% |
| East Asia | 254626 | 22 | 209198 | 226815 | 254626 | 12.26% |
| Bangladesh | 1442 | 11 | 1494 | 1468 | 1442 | -1.77% |
| Bhutan | 3249 | 69 | 3035 | 3141 | 3249 | 3.44% |
| Brunei Darussalam | 380 | 72 | 413 | 397 | 380 | -4.28% |
| Cambodia | 10094 | 57 | 12944 | 11546 | 10094 | -12.58% |
| India | 68434 | 23 | 63939 | 65390 | 68434 | 4.66% |
| Indonesia | 94432 | 52 | 118545 | 99409 | 94432 | -5.01% |
| Lao People’s Democratic Republic | 15751 | 68 | 17314 | 16532 | 15751 | -4.72% |
| Malaysia | 20456 | 62 | 22376 | 21591 | 20456 | -5.26% |
| Maldives | 1 | 3 | 1 | 1 | 1 | 0.00% |
| Myanmar | 31773 | 48 | 39218 | 34868 | 31773 | -8.88% |
| Nepal | 3636 | 25 | 4817 | 3900 | 3636 | -6.77% |
| Pakistan | 1687 | 2 | 2527 | 2116 | 1687 | -20.27% |
| Philippines | 7665 | 26 | 6570 | 7117 | 7665 | 7.70% |
| Singapore | 2 | 3 | 2 | 2 | 2 | 0.00% |
| Sri Lanka | 1860 | 29 | 2350 | 2082 | 1860 | -10.66% |
| Thailand | 18972 | 37 | 19549 | 19004 | 18972 | -0.17% |
| Timor-Leste | 742 | 50 | 966 | 854 | 742 | -13.11% |
| Viet Nam | 13797 | 44 | 9363 | 11725 | 13797 | 17.67% |
| South and South-east Asia | 294373 | 35 | 325423 | 301143 | 294373 | -2.25% |
| Afghanistan | 1350 | 2 | 1350 | 1350 | 1350 | 0.00% |
| Armenia | 262 | 9 | 347 | 304 | 262 | -13.82% |
| Azerbaijan | 936 | 11 | 936 | 936 | 936 | 0.00% |
| Bahrain | 1 | 1 | n.s. | n.s. | 1 | – |
| Cyprus | 173 | 19 | 161 | 172 | 173 | 0.58% |
| Georgia | 2742 | 39 | 2779 | 2768 | 2742 | -0.94% |
| Iran (Islamic Republic of) | 11075 | 7 | 11075 | 11075 | 11075 | 0.00% |
| Iraq | 825 | 2 | 804 | 818 | 825 | 0.86% |
| Israel | 154 | 7 | 132 | 153 | 154 | 0.65% |
| Jordan | 98 | 1 | 98 | 98 | 98 | 0.00% |
| Kazakhstan | 3309 | 1 | 3422 | 3365 | 3309 | -1.66% |
| Kuwait | 6 | n.s. | 3 | 5 | 6 | 20.00% |
| Kyrgyzstan | 954 | 5 | 836 | 858 | 954 | 11.19% |
| Lebanon | 137 | 13 | 131 | 131 | 137 | 4.58% |
| Occupied Palestinian Territory | 9 | 2 | 9 | 9 | 9 | 0.00% |
| Oman | 2 | n.s. | 2 | 2 | 2 | 0.00% |
| Qatar | 0 | 0 | 0 | 0 | 0 | – |
| Saudi Arabia | 977 | n.s. | 977 | 977 | 977 | 0.00% |
| Syrian Arab Republic | 491 | 3 | 372 | 432 | 491 | 13.66% |
| Tajikistan | 410 | 3 | 408 | 410 | 410 | 0.00% |
| Turkey | 11334 | 15 | 9680 | 10146 | 11334 | 11.71% |
| Turkmenistan | 4127 | 9 | 4127 | 4127 | 4127 | 0.00% |
| United Arab Emirates | 317 | 4 | 245 | 310 | 317 | 2.26% |
| Uzbekistan | 3276 | 8 | 3045 | 3212 | 3276 | 1.99% |
| Yemen | 549 | 1 | 549 | 549 | 549 | 0.00% |
| Western and Central Asia | 43513 | 4 | 41489 | 42207 | 43513 | 3.09% |
| Asia | 592512 | 19 | 576110 | 570164 | 592512 | 3.92% |
| Albania | 776 | 28 | 789 | 769 | 776 | 0.91% |
| Andorra | 16 | 36 | 16 | 16 | 16 | 0.00% |
| Austria | 3887 | 47 | 3776 | 3838 | 3887 | 1.28% |
| Belarus | 8630 | 42 | 7780 | 8273 | 8630 | 4.32% |
| Belgium | 678 | 22 | 677 | 667 | 678 | 1.65% |
| Bosnia and Herzegovina | 2185 | 43 | 2210 | 2185 | 2185 | 0.00% |
| Bulgaria | 3927 | 36 | 3327 | 3375 | 3927 | 16.36% |
| Croatia | 1920 | 34 | 1850 | 1885 | 1920 | 1.86% |
| Czech Republic | 2657 | 34 | 2629 | 2637 | 2657 | 0.76% |
| Denmark | 544 | 13 | 445 | 486 | 544 | 11.93% |
| Estonia | 2217 | 52 | 2090 | 2243 | 2217 | -1.16% |
| Faroe Islands | n.s. | n.s. | n.s. | n.s. | n.s. | – |
| Finland | 22157 | 73 | 21889 | 22459 | 22157 | -1.34% |
| France | 15954 | 29 | 14537 | 15353 | 15954 | 3.91% |
| Germany | 11076 | 32 | 10741 | 11076 | 11076 | 0.00% |
| Gibraltar | 0 | 0 | 0 | 0 | 0 | – |
| Greece | 3903 | 30 | 3299 | 3601 | 3903 | 8.39% |
| Guernsey | n.s. | 3 | n.s. | n.s. | n.s. | – |
| Holy See | 0 | 0 | 0 | 0 | 0 | – |
| Hungary | 2029 | 23 | 1801 | 1907 | 2029 | 6.40% |
| Iceland | 30 | n.s. | 9 | 18 | 30 | 66.67% |
| Ireland | 739 | 11 | 465 | 635 | 739 | 16.38% |
| Isle of Man | 3 | 6 | 3 | 3 | 3 | 0.00% |
| Italy | 9149 | 31 | 7590 | 8369 | 9149 | 9.32% |
| Jersey | 1 | 5 | 1 | 1 | 1 | 0.00% |
| Latvia | 3354 | 54 | 3173 | 3241 | 3354 | 3.49% |
| Liechtenstein | 7 | 43 | 7 | 7 | 7 | 0.00% |
| Lithuania | 2160 | 34 | 1945 | 2020 | 2160 | 6.93% |
| Luxembourg | 87 | 33 | 86 | 87 | 87 | 0.00% |
| Malta | n.s. | 1 | n.s. | n.s. | n.s. | – |
| Monaco | 0 | 0 | 0 | 0 | 0 | – |
| Montenegro | 543 | 40 | 543 | 543 | 543 | 0.00% |
| Netherlands | 365 | 11 | 345 | 360 | 365 | 1.39% |
| Norway | 10065 | 33 | 9130 | 9301 | 10065 | 8.21% |
| Poland | 9337 | 30 | 8881 | 9059 | 9337 | 3.07% |
| Portugal | 3456 | 38 | 3327 | 3420 | 3456 | 1.05% |
| Republic of Moldova | 386 | 12 | 319 | 324 | 386 | 19.14% |
| Romania | 6573 | 29 | 6371 | 6366 | 6573 | 3.25% |
| Russian Federationa | 809090 | 49 | 808950 | 809269 | 809090 | -0.02% |
| San Marino | 0 | 0 | 0 | 0 | 0 | – |
| Serbia | 2713 | 31 | 2313 | 2460 | 2713 | 10.28% |
| Slovakia | 1933 | 40 | 1922 | 1921 | 1933 | 0.62% |
| Slovenia | 1253 | 62 | 1188 | 1233 | 1253 | 1.62% |
| Spain | 18173 | 36 | 13818 | 16988 | 18173 | 6.98% |
| Svalbard and Jan Mayen Islands | 0 | 0 | 0 | 0 | 0 | – |
| Sweden | 28203 | 69 | 27281 | 27389 | 28203 | 2.97% |
| Switzerland | 1240 | 31 | 1151 | 1194 | 1240 | 3.85% |
| The former Yugoslav Republic of Macedonia | 998 | 39 | 912 | 958 | 998 | 4.18% |
| Ukraine | 9705 | 17 | 9274 | 9510 | 9705 | 2.05% |
| United Kingdom | 2881 | 12 | 2611 | 2793 | 2881 | 3.15% |
| Europe | 1005001 | 45 | 989471 | 998239 | 1005001 | 0.68% |
| Anguilla | 6 | 60 | 6 | 6 | 6 | 0.00% |
| Antigua and Barbuda | 10 | 22 | 10 | 10 | 10 | 0.00% |
| Aruba | n.s. | 2 | n.s. | n.s. | n.s. | – |
| Bahamas | 515 | 51 | 515 | 515 | 515 | 0.00% |
| Barbados | 8 | 19 | 8 | 8 | 8 | 0.00% |
| Bermuda | 1 | 20 | 1 | 1 | 1 | 0.00% |
| British Virgin Islands | 4 | 24 | 4 | 4 | 4 | 0.00% |
| Cayman Islands | 13 | 50 | 13 | 13 | 13 | 0.00% |
| Cuba | 2870 | 26 | 2058 | 2435 | 2870 | 17.86% |
| Dominica | 45 | 60 | 50 | 47 | 45 | -4.26% |
| Dominican Republic | 1972 | 41 | 1972 | 1972 | 1972 | 0.00% |
| Grenada | 17 | 50 | 17 | 17 | 17 | 0.00% |
| Guadeloupe | 64 | 39 | 67 | 65 | 64 | -1.54% |
| Haiti | 101 | 4 | 116 | 109 | 101 | -7.34% |
| Jamaica | 337 | 31 | 345 | 341 | 337 | -1.17% |
| Martinique | 49 | 46 | 49 | 49 | 49 | 0.00% |
| Montserrat | 3 | 24 | 4 | 3 | 3 | 0.00% |
| Netherlands Antilles | 1 | 1 | 1 | 1 | 1 | 0.00% |
| Puerto Rico | 552 | 62 | 287 | 464 | 552 | 18.97% |
| Saint Kitts and Nevis | 11 | 42 | 11 | 11 | 11 | 0.00% |
| Saint Lucia | 47 | 77 | 44 | 47 | 47 | 0.00% |
| Saint Martin (French part) | 1 | 19 | 1 | 1 | 1 | 0.00% |
| Saint Vincent and the Grenadines | 27 | 68 | 25 | 26 | 27 | 3.85% |
| Saint Barthélemy | 0 | 0 | 0b | 0 | 0 | – |
| Trinidad and Tobago | 226 | 44 | 241 | 234 | 226 | -3.42% |
| Turks and Caicos Islands | 34 | 80 | 34 | 34 | 34 | 0.00% |
| United States Virgin Islands | 20 | 58 | 24 | 22 | 20 | -9.09% |
| Caribbean | 6933 | 30 | 5902 | 6434 | 6933 | 7.76% |
| Belize | 1393 | 61 | 1586 | 1489 | 1393 | -6.45% |
| Costa Rica | 2605 | 51 | 2564 | 2376 | 2605 | 9.64% |
| El Salvador | 287 | 14 | 377 | 332 | 287 | -13.55% |
| Guatemala | 3657 | 34 | 4748 | 4208 | 3657 | -13.09% |
| Honduras | 5192 | 46 | 8136 | 6392 | 5192 | -18.77% |
| Nicaragua | 3114 | 26 | 4514 | 3814 | 3114 | -18.35% |
| Panama | 3251 | 44 | 3792 | 3369 | 3251 | -3.50% |
| Central America | 19499 | 38 | 25717 | 21980 | 19499 | -11.29% |
| Canada | 310134 | 34 | 310134 | 310134 | 310134 | 0.00% |
| Greenland | n.s. | n.s. | n.s. | n.s. | n.s. | – |
| Mexico | 64802 | 33 | 70291 | 66751 | 64802 | -2.92% |
| Saint Pierre and Miquelon | 3 | 13 | 3 | 3 | 3 | 0.00% |
| United States of America | 304022 | 33 | 296335 | 300195 | 304022 | 1.27% |
| North America | 678961 | 33 | 676764 | 677083 | 678961 | 0.28% |
| North and Central America | 705393 | 33 | 708383 | 705497 | 705393 | -0.01% |
| American Samoa | 18 | 89 | 18 | 18 | 18 | 0.00% |
| Australia | 149300 | 19 | 154500 | 154920 | 149300 | -3.63% |
| Cook Islands | 16 | 65 | 15 | 16 | 16 | 0.00% |
| Fiji | 1014 | 56 | 953 | 980 | 1014 | 3.47% |
| French Polynesia | 155 | 42 | 55b | 105 | 155 | 47.62% |
| Guam | 26 | 47 | 26 | 26 | 26 | 0.00% |
| Kiribati | 12 | 15 | 12 | 12 | 12 | 0.00% |
| Marshall Islands | 13 | 70 | 13 | 13 | 13 | 0.00% |
| Micronesia | 64 | 92 | 64 | 64 | 64 | 0.00% |
| Nauru | 0 | 0 | 0 | 0 | 0 | – |
| New Caledonia | 839 | 46 | 839 | 839 | 839 | 0.00% |
| New Zealand | 8269 | 31 | 7720 | 8266 | 8269 | 0.04% |
| Niue | 19 | 72 | 21 | 20 | 19 | -5.00% |
| Norfolk Island | n.s. | 12 | n.s. | n.s. | n.s. | – |
| Northern Mariana Islands | 30 | 66 | 34 | 32 | 30 | -6.25% |
| Palau | 40 | 88 | 38 | 40 | 40 | 0.00% |
| Papua New Guinea | 28726 | 63 | 31523 | 30133 | 28726 | -4.67% |
| Pitcairn | 4 | 83 | 4 | 4 | 4 | 0.00% |
| Samoa | 171 | 60 | 130 | 171 | 171 | 0.00% |
| Solomon Islands | 2213 | 79 | 2324 | 2268 | 2213 | -2.43% |
| Tokelau | 0 | 0 | 0 | 0 | 0 | – |
| Tonga | 9 | 13 | 9 | 9 | 9 | 0.00% |
| Tuvalu | 1 | 33 | 1 | 1 | 1 | 0.00% |
| Vanuatu | 440 | 36 | 440 | 440 | 440 | 0.00% |
| Wallis and Futuna Islands | 6 | 42 | 6 | 6 | 6 | 0.00% |
| Oceania | 191384 | 23 | 198744 | 198381 | 191384 | -3.53% |
| Argentina | 29400 | 11 | 34793 | 31861 | 29400 | -7.72% |
| Bolivia | 57196 | 53 | 62795 | 60091 | 57196 | -4.82% |
| Brazil | 519522 | 62 | 574839 | 545943 | 519522 | -4.84% |
| Chile | 16231 | 22 | 15263 | 15834 | 16231 | 2.51% |
| Colombia | 60499 | 55 | 62519 | 61509 | 60499 | -1.64% |
| Ecuador | 9865 | 36 | 13817 | 11841 | 9865 | -16.69% |
| Falkland Islands (Malvinas) | 0 | 0 | 0 | 0 | 0 | – |
| French Guiana | 8082 | 98 | 8188 | 8118 | 8082 | -0.44% |
| Guyana | 15205 | 77 | 15205 | 15205 | 15205 | 0.00% |
| Paraguay | 17582 | 44 | 21157 | 19368 | 17582 | -9.22% |
| Peru | 67992 | 53 | 70156 | 69213 | 67992 | -1.76% |
| Suriname | 14758 | 95 | 14776 | 14776 | 14758 | -0.12% |
| Uruguay | 1744 | 10 | 920 | 1412 | 1744 | 23.51% |
| Venezuela | 46275 | 52 | 52026 | 49151 | 46275 | -5.85% |
| South America | 864351 | 49 | 946454 | 904322 | 864351 | -4.42% |
| World | 4033060 | 31 | 4168399 | 4085168 | 4033060 | -1.28% |
| Primary forest | Plantations | |||||||
| Change | Change | |||||||
| Country | 1990 | 2000 | 2010 | 2010 vs 2000 | 1990 | 2000 | 2010 | 2010 vs 2000 |
| 1000 ha | 1000 ha | 1000 ha | 1000 ha | 1000 ha | 1000 ha | |||
| 0 | 0 | 0 | – | 140 | 134 | 128 | -4.48% | |
| 0 | 0 | 0 | – | 0 | 0 | 0 | – | |
| Angola | 0 | 0 | 0 | – | 2 | 2 | 1 | -50.00% |
| Botswana | 0 | 0 | 0 | – | 0 | 0 | 0 | – |
| Comoros | 0 | 0 | 0 | – | 10 | 21 | 34 | 61.90% |
| Djibouti | 0 | 0 | 0 | – | 491 | 491 | 511 | 4.07% |
| Eritrea | 694 | 674 | 654 | -2.97% | 238 | 212 | 197 | -7.08% |
| Ethiopia | 0 | 0 | 0 | – | 6 | 8 | 10 | 25.00% |
| Kenya | 3367 | 3214 | 3036 | -5.54% | 231 | 272 | 415 | 52.57% |
| Lesotho | 1727 | 1330 | 934 | -29.77% | 132 | 197 | 365 | 85.28% |
| Madagascar | 0 | 0 | 0 | – | 15 | 15 | 15 | 0.00% |
| Malawi | 1 | 1 | 1 | 0.00% | n.s. | n.s. | 1 | – |
| Mauritius | 0 | 0 | 0 | – | 38 | 38 | 62 | 63.16% |
| Mayotte | 0 | 0 | 0 | – | 0 | 0 | n.s. | – |
| Mozambique | 55 | 55 | 55 | 0.00% | 5 | 5 | 5 | 0.00% |
| Namibia | 2 | 2 | 2 | 0.00% | 5 | 5 | 5 | 0.00% |
| Réunion | 0 | 0 | 0 | – | 3 | 3 | 3 | 0.00% |
| Seychelles | 947 | 947 | 947 | 0.00% | 1626 | 1724 | 1763 | 2.26% |
| Somalia | 0 | 0 | 0 | – | 160 | 150 | 140 | -6.67% |
| South Africa | 0 | 0 | 0 | – | 34 | 32 | 51 | 59.38% |
| Swaziland | 0 | 0 | 0 | – | 150 | 200 | 240 | 20.00% |
| Uganda | 0 | 0 | 0 | – | 60 | 60 | 62 | 3.33% |
| Tanzania | 801 | 801 | 801 | 0.00% | 154 | 120 | 108 | -10.00% |
| Zambia | – | – | – | – | – | – | – | – |
| Zimbabwe | 0 | 0 | 0 | – | 333 | 345 | 404 | 17.10% |
| Eastern and Southern Africa | 0 | 0 | 0 | – | 44 | 59 | 70 | 18.64% |
| Algeria | 0 | 0 | 0 | – | 217 | 217 | 217 | 0.00% |
| Egypt | 0 | 0 | 0 | – | 5 | 13 | 21 | 61.54% |
| Libyan Arab Jamahiriya | 0 | 0 | 0 | – | 478 | 523 | 621 | 18.74% |
| Mauritania | 15276 | 14098 | 13990 | -0.77% | 5424 | 5639 | 6068 | 7.61% |
| Morocco | 0 | 0 | 0 | – | 293 | 519 | 690 | 32.95% |
| Sudan | 0 | 0 | 0 | – | 0 | 0 | 0 | – |
| Tunisia | – | – | – | – | – | – | – | – |
| Western Sahara | 0 | 0 | 0 | – | 10 | 13 | 19 | 46.15% |
| Northern Africa | 0 | 0 | 0 | – | 7 | 58 | 109 | 87.93% |
| Benin | 110 | 40 | 40 | 0.00% | 0 | 86 | 69 | -19.77% |
| Burkina Faso | – | – | – | – | – | – | – | – |
| Burundi | 0 | 0 | 0 | – | 58 | 82 | 85 | 3.66% |
| Cameroon | 3900 | 3135 | 2370 | -24.40% | 2 | 2 | 2 | 0.00% |
| Cape Verde | 209 | 196 | 184 | -6.12% | 11 | 14 | 17 | 21.43% |
| Central African Republic | 7548 | 7492 | 7436 | -0.75% | 51 | 51 | 75 | 47.06% |
| Chad | 625 | 625 | 625 | 0.00% | 154 | 261 | 337 | 29.12% |
| Congo | – | – | – | – | 56 | 57 | 59 | 3.51% |
| Côte d’Ivoire | 0 | 0 | 0 | – | 0 | n.s. | n.s. | – |
| Democratic Republic of the Congo | 20934 | 17634 | 14334 | -18.71% | 30 | 30 | 30 | 0.00% |
| Equatorial Guinea | 1 | 1 | 1 | 0.00% | 1 | 1 | 1 | 0.00% |
| Gabon | 395 | 395 | 395 | 0.00% | 50 | 60 | 260 | 333.33% |
| Gambia | 63 | 63 | 63 | 0.00% | 60 | 72 | 93 | 29.17% |
| Ghana | 0 | 0 | 0 | – | n.s. | n.s. | 1 | – |
| Guinea | 175 | 175 | 175 | 0.00% | 8 | 8 | 8 | 0.00% |
| Guinea-Bissau | 0 | 0 | 0 | – | 5 | 55 | 530 | 863.64% |
| Liberia | 220 | 220 | 220 | 0.00% | 48 | 73 | 148 | 102.74% |
| Mali | 1556 | 736 | n.s. | – | 251 | 316 | 382 | 20.89% |
| Niger | 7 | 7 | 7 | 0.00% | 248 | 282 | 373 | 32.27% |
| Nigeria | – | – | – | – | – | – | – | – |
| Rwanda | 11 | 11 | 11 | 0.00% | 0 | 0 | 0 | – |
| Saint Helena, Ascension and Tristan da Cunha | 1759 | 1653 | 1553 | -6.05% | 205 | 306 | 464 | 51.63% |
| Sao Tome and Principe | 224 | 157 | 113 | -28.03% | 7 | 8 | 15 | 87.50% |
| Senegal | 0 | 0 | 0 | – | 24 | 34 | 42 | 23.53% |
| Sierra Leone | – | – | – | – | – | – | – | – |
| Togo | – | – | – | – | – | – | – | – |
| Western and Central Africa | 11646 | 11632 | 11632 | 0.00% | 41950 | 54394 | 77157 | 41.85% |
| Africa | 1129 | 954 | 780 | -18.24% | 1130 | 955 | 781 | -18.22% |
| China | 3764 | 4054 | 4747 | 17.09% | 10287 | 10331 | 10326 | -0.05% |
| Democratic People’s Republic of Korea | 6043 | 5539 | 5152 | -6.99% | 25 | 76 | 145 | 90.79% |
| Japan | – | 4277 | 2957 | -30.86% | – | 1738 | 1823 | 4.89% |
| Mongolia | – | – | – | – | – | – | – | – |
| Republic of Korea | 436 | 436 | 436 | 0.00% | 239 | 271 | 237 | -12.55% |
| East Asia | 413 | 413 | 413 | 0.00% | 1 | 2 | 3 | 50.00% |
| Bangladesh | 313 | 288 | 263 | -8.68% | 1 | 1 | 3 | 200.00% |
| Bhutan | 766 | 456 | 322 | -29.39% | 67 | 79 | 69 | -12.66% |
| Brunei Darussalam | 15701 | 15701 | 15701 | 0.00% | 5716 | 7167 | 10211 | 42.47% |
| Cambodia | – | 49270 | 47236 | -4.13% | – | 3672 | 3549 | -3.35% |
| India | 1490 | 1490 | 1490 | 0.00% | 3 | 99 | 224 | 126.26% |
| Indonesia | 3820 | 3820 | 3820 | 0.00% | 1956 | 1659 | 1807 | 8.92% |
| Lao People’s Democratic Republic | – | – | – | – | – | – | – | – |
| Malaysia | 3192 | 3192 | 3192 | 0.00% | 394 | 696 | 988 | 41.95% |
| Maldives | 391 | 548 | 526 | -4.01% | 40 | 42 | 43 | 2.38% |
| Myanmar | 0 | 0 | 0 | – | 234 | 296 | 340 | 14.86% |
| Nepal | 861 | 861 | 861 | 0.00% | 302 | 327 | 352 | 7.65% |
| Pakistan | 2 | 2 | 2 | 0.00% | 0 | 0 | 0 | – |
| Philippines | 257 | 197 | 167 | -15.23% | 242 | 221 | 185 | -16.29% |
| Singapore | 6726 | 6726 | 6726 | 0.00% | 2668 | 3111 | 3986 | 28.13% |
| Sri Lanka | 0 | 0 | 0 | – | 29 | 43 | 43 | 0.00% |
| Thailand | 384 | 187 | 80 | -57.22% | 967 | 2050 | 3512 | 71.32% |
| Timor-Leste | – | – | – | – | – | – | – | – |
| Viet Nam | – | – | – | – | – | – | – | – |
| South and South-east Asia | 17 | 15 | 13 | -13.33% | 14 | 11 | 21 | 90.91% |
| Afghanistan | 400 | 400 | 400 | 0.00% | 20 | 20 | 20 | 0.00% |
| Armenia | 0 | 0 | 0 | – | n.s. | n.s. | 1 | – |
| Azerbaijan | 13 | 13 | 13 | 0.00% | 24 | 28 | 31 | 10.71% |
| Bahrain | 500 | 500 | 500 | 0.00% | 54 | 60 | 184 | 206.67% |
| Cyprus | 200 | 200 | 200 | 0.00% | 844 | 844 | 844 | 0.00% |
| Georgia | 0 | 0 | 0 | – | 15 | 15 | 15 | 0.00% |
| Iran (Islamic Republic of) | 0 | 0 | 0 | – | 66 | 88 | 88 | 0.00% |
| Iraq | – | – | 0 | – | – | – | 47 | – |
| Israel | 0 | 0 | 0 | – | 1034 | 1056 | 901 | -14.68% |
| Jordan | 0 | 0 | 0 | – | 3 | 5 | 6 | 20.00% |
| Kazakhstan | 237 | 240 | 269 | 12.08% | 46 | 59 | 57 | -3.39% |
| Kuwait | – | – | 0 | – | – | – | 11 | – |
| Kyrgyzstan | – | – | – | – | – | – | – | – |
| Lebanon | 0 | 0 | 0 | – | 2 | 2 | 2 | 0.00% |
| Occupied Palestinian Territory | 0 | 0 | 0 | – | 0 | 0 | 0 | – |
| Oman | 360 | 360 | 360 | 0.00% | 0 | 0 | 0 | – |
| Qatar | 0 | 0 | 0 | – | 175 | 234 | 294 | 25.64% |
| Saudi Arabia | 297 | 297 | 297 | 0.00% | 99 | 101 | 101 | 0.00% |
| Syrian Arab Republic | 739 | 897 | 973 | 8.47% | 1778 | 2344 | 3418 | 45.82% |
| Tajikistan | 104 | 104 | 104 | 0.00% | 0 | 0 | 0 | – |
| Turkey | 0 | 0 | 0 | – | 245 | 310 | 317 | 2.26% |
| Turkmenistan | 57 | 57 | 72 | 26.32% | 203 | 464 | 635 | 36.85% |
| United Arab Emirates | 0 | 0 | 0 | – | 0 | 0 | 0 | – |
| Uzbekistan | – | – | – | – | – | – | – | – |
| Yemen | – | – | – | – | – | – | – | – |
| Western and Central Asia | 85 | 85 | 85 | 0.00% | 103 | 96 | 94 | -2.08% |
| Asia | – | – | – | – | – | – | – | – |
| Albania | – | – | – | – | – | – | – | – |
| Andorra | 400 | 400 | 400 | 0.00% | 1518 | 1692 | 1857 | 9.75% |
| Austria | 0 | 0 | 0 | – | 446 | 408 | 396 | -2.94% |
| Belarus | 2 | 2 | 2 | 0.00% | 1047 | 999 | 999 | 0.00% |
| Belgium | 157 | 270 | 338 | 25.19% | 1032 | 933 | 815 | -12.65% |
| Bosnia and Herzegovina | 7 | 7 | 7 | 0.00% | 92 | 81 | 70 | -13.58% |
| Bulgaria | 9 | 9 | 9 | 0.00% | 2610 | 2616 | 2635 | 0.73% |
| Croatia | 21 | 23 | 25 | 8.70% | 331 | 361 | 407 | 12.74% |
| Czech Republic | – | 976 | 964 | -1.23% | – | 170 | 168 | -1.18% |
| Denmark | – | – | – | – | – | – | – | – |
| Estonia | 0 | 0 | 0 | – | 4393 | 4956 | 5904 | 19.13% |
| Faroe Islands | 30 | 30 | 30 | 0.00% | 1539 | 1593 | 1633 | 2.51% |
| Finland | 0 | 0 | 0 | – | 5121 | 5283 | 5283 | 0.00% |
| France | 0 | 0 | 0 | – | 0 | 0 | 0 | – |
| Germany | 0 | 0 | 0 | – | 118 | 129 | 140 | 8.53% |
| Gibraltar | – | – | – | – | – | – | – | – |
| Greece | 0 | 0 | 0 | – | 0 | 0 | 0 | – |
| Guernsey | 0 | 0 | 0 | – | 1453 | 1509 | 1612 | 6.83% |
| Holy See | 0 | 0 | 0 | – | 6 | 15 | 27 | 80.00% |
| Hungary | 0 | 0 | 0 | – | 383 | 553 | 657 | 18.81% |
| Iceland | – | – | – | – | – | – | – | – |
| Ireland | 93 | 93 | 93 | 0.00% | 547 | 584 | 621 | 6.34% |
| Isle of Man | – | – | – | – | – | – | – | – |
| Italy | 17 | 17 | 15 | -11.76% | 724 | 709 | 628 | -11.42% |
| Jersey | 2 | 2 | 2 | 0.00% | n.s. | n.s. | n.s. | – |
| Latvia | 20 | 21 | 26 | 23.81% | 411 | 461 | 521 | 13.02% |
| Liechtenstein | 0 | 0 | 0 | – | 28 | 28 | 28 | 0.00% |
| Lithuania | 0 | 0 | 0 | – | n.s. | n.s. | n.s. | – |
| Luxembourg | 0 | 0 | 0 | – | 0 | 0 | 0 | – |
| Malta | – | – | – | – | – | – | – | – |
| Monaco | 0 | 0 | 0 | – | 345 | 360 | 365 | 1.39% |
| Montenegro | 223 | 223 | 223 | 0.00% | 1089 | 1325 | 1475 | 11.32% |
| Netherlands | 30 | 51 | 54 | 5.88% | 8511 | 8645 | 8889 | 2.82% |
| Norway | – | 24 | 24 | 0.00% | – | 776 | 849 | 9.41% |
| Poland | 0 | 0 | 0 | – | 1 | 1 | 2 | 100.00% |
| Portugal | 300 | 300 | 300 | 0.00% | 1402 | 1401 | 1446 | 3.21% |
| Republic of Moldova | 241726 | 258131 | 256482 | -0.64% | 12651 | 15360 | 16991 | 10.62% |
| Romania | 0 | 0 | 0 | – | 0 | 0 | 0 | – |
| Russian Federationa | 1 | 1 | 1 | 0.00% | 39 | 39 | 180 | 361.54% |
| San Marino | 24 | 24 | 24 | 0.00% | 960 | 958 | 959 | 0.10% |
| Serbia | 63 | 95 | 109 | 14.74% | 34 | 36 | 32 | -11.11% |
| Slovakia | 0 | 0 | 0 | – | 2038 | 2505 | 2680 | 6.99% |
| Slovenia | 0 | 0 | 0 | – | 0 | 0 | 0 | – |
| Spain | 2609 | 2609 | 2609 | 0.00% | 2328 | 3557 | 3613 | 1.57% |
| Svalbard and Jan Mayen Islands | 40 | 40 | 40 | 0.00% | 159 | 165 | 172 | 4.24% |
| Sweden | 0 | 0 | 0 | – | 105 | 105 | 105 | 0.00% |
| Switzerland | 59 | 59 | 59 | 0.00% | 4637 | 4755 | 4846 | 1.91% |
| The former Yugoslav Republic of Macedonia | 0 | 0 | 0 | – | 1965 | 2145 | 2219 | 3.45% |
| Ukraine | – | – | – | – | – | – | – | – |
| United Kingdom | – | – | – | – | – | – | – | – |
| Europe | – | – | – | – | – | – | – | – |
| Anguilla | – | – | – | – | – | – | – | – |
| Antigua and Barbuda | 0 | 0 | 0 | – | 0 | 0 | 0 | – |
| Aruba | 0 | 0 | 0 | – | n.s. | n.s. | n.s. | – |
| Bahamas | – | – | – | – | – | – | – | – |
| Barbados | – | – | – | – | – | – | – | – |
| Bermuda | – | – | – | – | – | – | – | – |
| British Virgin Islands | 0 | 0 | 0 | – | 347 | 342 | 486 | 42.11% |
| Cayman Islands | 28 | 28 | 27 | -3.57% | 0 | n.s. | n.s. | – |
| Cuba | – | – | – | – | – | – | – | – |
| Dominica | 2 | 2 | 2 | 0.00% | n.s. | n.s. | n.s. | – |
| Dominican Republic | 15 | 15 | 15 | 0.00% | 4 | 4 | 4 | 0.00% |
| Grenada | 0 | 0 | 0 | – | 12 | 20 | 28 | 40.00% |
| Guadeloupe | 89 | 88 | 88 | 0.00% | 9 | 8 | 7 | -12.50% |
| Haiti | 0 | 0 | 0 | – | 2 | 2 | 2 | 0.00% |
| Jamaica | 0 | 0 | 0 | – | 0 | 0 | 0 | – |
| Martinique | – | – | – | – | – | – | – | – |
| Montserrat | 0 | 0 | 0 | – | 0 | 0 | 0 | – |
| Netherlands Antilles | – | – | – | – | – | – | – | – |
| Puerto Rico | 10 | 10 | 12 | 20.00% | 1 | 1 | 1 | 0.00% |
| Saint Kitts and Nevis | – | – | – | – | – | – | – | – |
| Saint Lucia | – | 0 | 0 | – | – | n.s. | n.s. | – |
| Saint Martin (French part) | 0 | 0 | 0 | – | 0 | 0 | 0 | – |
| Saint Vincent and the Grenadines | 62 | 62 | 62 | 0.00% | 15 | 16 | 18 | 12.50% |
| Saint Barthélemy | – | – | – | – | – | – | – | – |
| Trinidad and Tobago | 0 | 0 | 0 | – | 0 | 0 | 0 | – |
| Turks and Caicos Islands | – | – | – | – | – | – | – | – |
| United States Virgin Islands | 599 | 599 | 599 | 0.00% | 2 | 2 | 2 | 0.00% |
| Caribbean | 623 | 623 | 623 | 0.00% | 295 | 203 | 241 | 18.72% |
| Belize | 5 | 5 | 5 | 0.00% | 10 | 13 | 15 | 15.38% |
| Costa Rica | 2359 | 2091 | 1619 | -22.57% | 51 | 93 | 173 | 86.02% |
| El Salvador | – | – | 457 | – | – | – | 0 | – |
| Guatemala | – | – | 1179 | – | – | – | 74 | – |
| Honduras | 0 | 0 | 0 | – | 13 | 44 | 79 | 79.55% |
| Nicaragua | – | – | – | – | – | – | – | – |
| Panama | 165448 | 165448 | 165448 | 0.00% | 1357 | 5820 | 8963 | 54.00% |
| Central America | 0 | 0 | 0 | – | n.s. | n.s. | n.s. | – |
| Canada | 39492 | 35469 | 34310 | -3.27% | 0 | 1058 | 3203 | 202.74% |
| Greenland | 0 | 0 | 0 | – | 0 | 0 | 0 | – |
| Mexico | 69980 | 72878 | 75277 | 3.29% | 17938 | 22560 | 25363 | 12.42% |
| Saint Pierre and Miquelon | – | – | – | – | – | – | – | – |
| United States of America | – | – | – | – | – | – | – | – |
| North America | – | – | – | – | – | – | – | – |
| North and Central America | – | – | 5039 | – | 1023 | 1176 | 1903 | 61.82% |
| American Samoa | 0 | 0 | 0 | – | 1 | 1 | 1 | 0.00% |
| Australia | 490 | 445 | 449 | 0.90% | 92 | 130 | 177 | 36.15% |
| Cook Islands | – | – | 40 | – | – | 9 | 10 | 11.11% |
| Fiji | – | – | – | – | – | – | – | – |
| French Polynesia | 0 | 0 | 0 | – | 0 | 0 | 0 | – |
| Guam | 8 | 8 | 8 | 0.00% | 4 | 4 | 4 | 0.00% |
| Kiribati | 40 | 44 | 48 | 9.09% | 20 | 17 | 14 | -17.65% |
| Marshall Islands | 0 | 0 | 0 | – | 0 | 0 | 0 | – |
| Micronesia | 431 | 431 | 431 | 0.00% | 9 | 10 | 10 | 0.00% |
| Nauru | – | – | 2144 | – | 1261 | 1809 | 1812 | 0.17% |
| New Caledonia | – | – | 6 | – | – | – | n.s. | – |
| New Zealand | – | – | – | – | – | – | – | – |
| Niue | 10 | 9 | 8 | -11.11% | 24 | 23 | 22 | -4.35% |
| Norfolk Island | – | – | – | – | – | – | – | – |
| Northern Mariana Islands | 31329 | 29534 | 26210 | -11.25% | 63 | 82 | 86 | 4.88% |
| Palau | – | – | – | – | – | – | – | – |
| Papua New Guinea | – | n.s. | n.s. | – | – | 32 | 32 | 0.00% |
| Pitcairn | 1105 | 1105 | 1105 | 0.00% | 44 | 28 | 27 | -3.57% |
| Samoa | 0 | 0 | 0 | – | 0 | 0 | 0 | – |
| Solomon Islands | 4 | 4 | 4 | 0.00% | 1 | 1 | 1 | 0.00% |
| Tokelau | – | – | – | – | – | – | – | – |
| Tonga | – | – | – | – | – | – | – | – |
| Tuvalu | – | – | – | – | n.s. | n.s. | 1 | – |
| Vanuatu | – | – | – | – | – | – | – | – |
| Wallis and Futuna Islands | 1738 | 1738 | 1738 | 0.00% | 766 | 1076 | 1394 | 29.55% |
| Oceania | 40804 | 39046 | 37164 | -4.82% | 20 | 20 | 20 | 0.00% |
| Argentina | 530041 | 501926 | 476573 | -5.05% | 4984 | 5176 | 7418 | 43.32% |
| Bolivia | 4631 | 4536 | 4439 | -2.14% | 1707 | 1936 | 2384 | 23.14% |
| Brazil | 8828 | 8685 | 8543 | -1.64% | 137 | 255 | 405 | 58.82% |
| Chile | – | 4682 | 4805 | 2.63% | – | 161 | 167 | 3.73% |
| Colombia | 0 | 0 | 0 | – | 0 | 0 | 0 | – |
| Ecuador | 8006 | 7816 | 7690 | -1.61% | 1 | 1 | 1 | 0.00% |
| Falkland Islands (Malvinas) | – | 6790 | 6790 | 0.00% | – | 0 | 0 | – |
| French Guiana | 1850 | 1850 | 1850 | 0.00% | 23 | 36 | 48 | 33.33% |
| Guyana | 62910 | 62188 | 60178 | -3.23% | 263 | 715 | 993 | 38.88% |
| Paraguay | 14208 | 14137 | 14001 | -0.96% | 13 | 13 | 13 | 0.00% |
| Peru | 288 | 297 | 306 | 3.03% | 201 | 669 | 978 | 46.19% |
| Suriname | – | – | – | – | – | – | – | – |
| Uruguay | – | – | – | – | – | – | – | – |
| Venezuela | – | – | – | – | – | – | – | – |
| South America | – | – | – | – | – | – | – | – |
| World | – | – | – | – | – | – | – | – |
NOTE: The text on primary forest loss has been clarified under the final photo caption and in the text. Some readers have been confused about the menaing of “loss of primary forest”. This refers to undisturbed (old growth) forest that is reclassified as ‘other naturally regenerated
forest’ because of selective logging and other human interventions. It does not neccessarily mean deforestation.
Related articles
Rainforest loss slows
(10/07/2010) Deforestation rates in tropical countries dropped significantly during the first decade of the 21st century relative to the 1990s, reveals new data released by the Food and Agriculture Organization of the United Nations (FAO). FAO figures show deforestation across 121 tropical countries averaged 9.34 million hectares per year between 2000 and 2010, down from 11.33 million hectares per year in the 1990s. The decline has accelerated since 2005 due Brazil’s dramatic reduction of deforestation in the Brazilian Amazon, which peaked at 27,772 square kilometers in 2004 but is expected to come in at less than 8,000 for 2010.
(09/29/2010) In recent years there has been an explosion in the number of satellite-based monitoring applications and technologies, which is perhaps best exemplified in the eyes of the public by Google Earth, which allows anyone with a decent internet connection to view overhead images of nearly any place on Earth. But these new applications are also helping scientists more effectively monitor environmental change, including the fluctuations in polar sea ice, shifts in oceanic plankton, and deforestation. An important factor in the expanded use of satellite imagery has been the U.S. government’s free Landsat Data Distribution Policy, which allows free or inexpensive access to data captured by Landsat satellites, which have been collected data on a regular basis since 1972. But the Landsat program is not presently operating at its full capacity, increasing the risk of a ‘data gap’ before a new system is in place in 2012.
Amazon deforestation falls significantly in 2010, according to preliminary data
(08/31/2010) Deforestation in the Brazilian Amazon is down significantly since last year, according to preliminary estimates released by Brazil’s National Institute for Space Research (INPE) and Imazon, a Brazil-based NGO that tracks forest loss and degradation across the Amazon. Analysis of NASA MODIS data by Imazon found some 1,488 square kilometers of forest were cleared during the 12 months ended July 31, 2010, down 16 percent from the same period last year, when 1,766 square kilometers were deforested. Meanwhile analysis by INPE shows an even steeper drop from 4,375 square kilometers in August 2008 through July 2009 to 2,296 square kilometers in the current period, a decline of 48 percent. The discrepancy between INPE’s and Imazon’s estimates results from differences in how deforestation is tracked.
Rainforest scientists urge UN to correct “serious loophole” by changing its definition of ‘forest’
(06/24/2010) The Association for Tropical Biology and Conservation (ATBC) has released a resolution urging the UN to change its definition for ‘forest’, before the controversial definition undermines conservation efforts, biodiversity preservation, carbon sequestration, and the nascent REDD (Reducing Emissions through Deforestation and forest Degradation).
Destruction of old-growth forests looms over climate talks

(12/08/2009) Destruction of old-growth or primary forests looms large in discussions in Copenhagen over a scheme to compensate tropical countries for reducing emissions from deforestation and degradation (REDD). Some environmental groups are pressing for conservation of old-growth forests — the most carbon-dense, and biologically-rich state of forests — to be the centerpiece of REDD, while industry and other actors are pushing for “sustainable forest management” or logging using reduced-impact techniques to be the primary focus of REDD.