New deforestation figures show Nigeria has worst rate of forest loss
[2010 update]
Nigeria has the world’s highest deforestation rate, Brazil loses the largest area of forest annually, and Congo consumes more bushmeat than any other tropical country. These are among the findings from mongabay.com’s analysis of new deforestation figures from the United Nations.
Monday, the Food and Agriculture Organization of the United Nations (FAO) released its 2005 Global Forest Resources Assessment, a regular report on the status world’s forest resources. Overall, FAO concludes that net deforestation rates have fallen since the 1990-2000 period, but some 13 million hectares of the world’s forests are still lost each year, including 6 million hectares of primary forests. Primary forests — forests with no visible signs of past or present human activities — are considered the most biologically diverse ecosystems on the planet.
Industrial logging, clearing and forest conversion for agriculture, fuelwood collection by rural poor, and forest fires — often purposely set by people — are considered the leading causes of deforestation.
South America
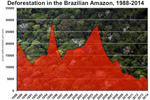
South America — where large tracts of the Amazon rainforest are being cleared for cattle ranches and soybean plantations — suffered the largest net loss of forests between 2000 and 2005 of around 4.3 million hectares per year. Scientists are concerned that forest loss could escalate in the Amazon due to increasingly dry conditions. This year the Amazon suffered the most severe drought on record, leaving rivers dry and communities stranded. Tens of thousands of fires burned.
Africa
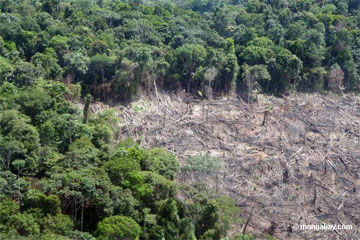 Clear-cutting of rainforest in Peru. Tropical deforestation is a major concern to ecologists. They warn that the loss of biodiversity has unknown consequences. Photo: Rhett A. Butler Please note: mongabay.com features thousands of pages on deforestation. Good places to start include: |
Africa suffered the second largest net loss in forests with 4.0 million hectares cleared annually. Nigeria and Sudan were the two largest losers of natural forest during the 2000-2005 period, largely due to subsistence activities. At 11.1%, Nigeria’s annual deforestation rate of natural forest is the highest in the world and puts it on pace to lose virtually all of its primary forest within a few years. Malawi, currently in the midst of a severe drought and famine, has the world’s fourth highest deforestation rate.
FAO figures also show Africa is more dependent on bushmeat — wild animals captured as food — than other tropical regions. Bushmeat availability has increased with the construction of logging roads in the rainforest and a number of well-known species including gorillas, chimpanzees, and monkeys are considered at highest risk. There is growing concern among health experts that bushmeat consumption may be linked to the outbreak of unusual tropical diseases including the Ebola virus and Marburg, which broke out earlier this year in Angola. Primates are known to be carriers of these diseases.
Central America, South Asia, and Southeast Asia lead deforestation rates
The regions with the highest tropical deforestation rate were Central America — which lost 1.3% or 285,000 hectares of its forests each year — and tropical Asia. Tropical Asia —
 Worst deforestation rate of natural forests, 2000-2005 Credits: R. Butler |
including the countries of Bangladesh, Bhutan, Brunei, Cambodia, East Timor, India, Indonesia, Laos, Malaysia, Maldives, Myanmar, Nepal, Pakistan, Philippines, Singapore, Sri Lanka, Thailand, and Vietnam — lost about 1% of its forests each year. According to FAO, Vietnam lost a staggering 51% of its primary forests between 2000 and 2005, while Cambodia lost 29% of its primary forests between 2000 and 2005 [Cambodia’s figures were revised by the FAO after this article was published. Original data showed Cambodia’s primary forest cover declining to 122,000 hectares in 2005 from 356,000 hectares in 2000. The new FAO data says Cambodia’s current primary forest cover stands at 322,000 hectares]. Illegal logging, combined with rapid development, is blamed for much of Cambodia’s forest loss.
Plantations offsetting natural forest
Due to a significant increase in plantation forests, forest cover has generally been expanding in North America, Europe and China while diminishing in the tropics. Plantations help offset the loss of natural forests but essentially result in an overall decline in global biodiversity as single species plantations replace their biologically richer natural counterparts.
The United States
The United States has the seventh largest annual loss of primary forests in the world, according to FAO. In the 2000-2005 period, the United States lost an average of 831 square miles (215,200 hectares, 2,152 square kilometers or 531,771 acres) of such lands which are sometimes termed “old-growth forests.”
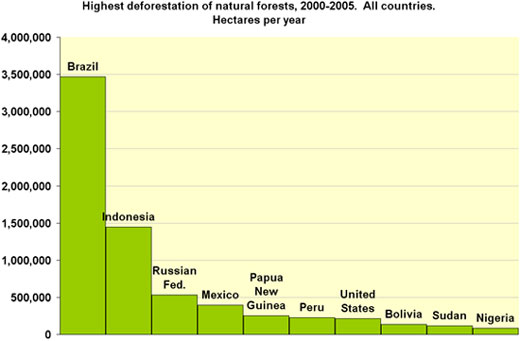 Highest deforestation of natural forests, 2000-2005. All countries. Credits: R. Butler |
Overall, when plantations are added to the picture, the US gained a net 614 square miles (159,000 hectares) of forest per year. The FAO report suggests America’s primary forests are losing ground to modified natural, seminatural, and plantation forests. Earlier this year, the government revoked President Clinton’s 2001 “Roadless Area Conservation Rule” that protected 58.5 million acres of undeveloped national forest, in effect opening more than 90,000 square miles of forests to road construction, logging and industrial development.
UN figures contested
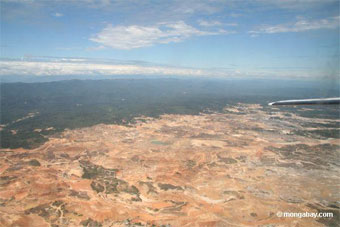 Gold-mining operation the Peruvian Amazon. Scientists are concerned over the global impact of deforestation in the tropics. The loss of forests adds the greenhouse gas carbon dioxide to the atmosphere while affecting local rainfall. Photo: Rhett A. Butler |
Some environmental groups have criticized the UN numbers as “misleading and inaccurate” saying that FAO is using industrial plantations to offset deforestation figures for natural forests while relying on flawed figures provided by governments that varying standards of forest monitoring. The London-based Rainforest Foundation notes that “the UN figure is based on a definition of forest as being an area with as little as 10% actual tree cover, which would therefore include areas that are actually savannah-like ecosystems and badly damaged forests.” Further, says a press release from the organization, “areas of land that presently have no trees on them at all, but that are ‘expected’ to regenerate, are also counted as forests.”
Despite the criticism, industry experts say that FAO has the best figures available across virtually all countries in the world. Mila Alvarez, who tracks forest trends for World Resources Institute and Global Forest Watch (globalforestwatch.org), told the New York Times “The F.A.O. is doing the best it can given what the governments are providing.” Alvarez says the World Resources Institute and other organizations are developing a way to use satellite imagery to analyze forest changes and to verify government estimates.
More deforestation information:
Nigeria has worst deforestation rate, FAO revises figures
Breaking deforestation news at the deforestation blog
Please note: mongabay.com features thousands of pages on deforestation. Good places to start include:
- Overview of deforestation
- Deforestation in the Amazon
- Deforestation blog
- Deforestation charts and graphs
- Deforestation pictures
- Explanation of deforestation for children
- Deforestation rates for specific countries
- Deforestation tables
- Explanation of deforestation for children
Deforestation Charts
[ large medium small ]
Deforestation in the Brazlian Amazon, 1988-present
context of the image
[ large medium small ]
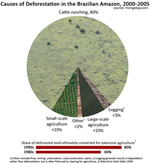
Causes of deforestation in the Brazilian Amazon, 2000-2005
context of the image
[ large medium small ]
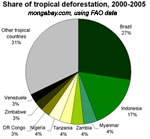
Share of tropical deforestation, 2000-2005
context of the image

Deforestation rates by country, 1990-2005
context of the image
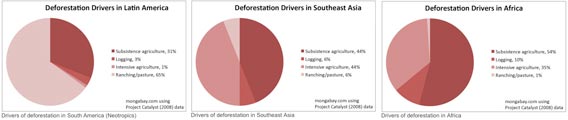
Regional drivers of deforestation
context of the image
Forest Tables
All area figures are in hectares.
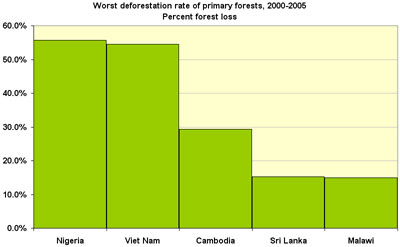
Worst deforestation rate of primary forests, 2000-2005. All countries.
| 1 | Nigeria | 55.7% | ||
| 2 | Viet Nam | 54.5% | ||
| 3 | Cambodia | 29.4% | ||
| 4 | Sri Lanka | 15.2% | ||
| 5 | Malawi | 14.9% | ||
| 6 | Indonesia | 12.9% | ||
| 7 | North Korea | 9.3% | ||
| 8 | Nepal | 9.1% | ||
| 9 | Panama | 6.7% | ||
| 10 | Guatemala | 6.4% | ||
Highest average annual deforestation of primary forests, 2000-2005, by area. All countries
| 1 | Brazil | -3,466,000 | ||
| 2 | Indonesia | -1,447,800 | ||
| 3 | Russian Federation | -532,200 | ||
| 4 | Mexico | -395,000 | ||
| 5 | Papua New Guinea | -250,200 | ||
| 6 | Peru | -224,600 | ||
| 7 | United States of America | -215,200 | ||
| 8 | Bolivia | -135,200 | ||
| 9 | Sudan | -117,807 | ||
| 10 | Nigeria | -82,000 | ||
Highest average annual deforestation of primary forests, 2000-2005, by area. Tropical countries
| 1 | Brazil | -3,466,000 | ||
| 2 | Indonesia | -1,447,800 | ||
| 3 | Mexico | -395,000 | ||
| 4 | Papua New Guinea | -250,200 | ||
| 5 | Peru | -224,600 | ||
| 6 | Bolivia | -135,200 | ||
| 7 | Sudan | -117,807 | ||
| 8 | Nigeria | -82,000 | ||
| 9 | Cambodia | -66,800 | ||
| 10 | Colombia | -56,160 | ||
| 11 | Panama | -43,200 | ||
| 12 | Malawi | -39,600 | ||
| 13 | Guatemala | -26,834 | ||
| 14 | Viet Nam | -20,400 | ||
| 15 | Democratic People’s Republic of Korea | -17,400 | ||
| 16 | French Guiana | -12,000 | ||
| 17 | Senegal | -11,000 | ||
| 18 | Nepal | -7,000 | ||
| 19 | Madagascar | -6,800 | ||
| 20 | Sri Lanka | -6,000 | ||
Most primary forest cover, 2005. All countries
| 1 | Brazil | 415,890 | ||
| 2 | Russian Federation | 255,470 | ||
| 3 | Canada | 165,424 | ||
| 4 | United States of America | 104,182 | ||
| 5 | Peru | 61,065 | ||
| 6 | Colombia | 53,062 | ||
| 7 | Indonesia | 48,702 | ||
| 8 | Mexico | 32,850 | ||
| 9 | Bolivia | 29,360 | ||
| 10 | Papua New Guinea | 25,211 | ||
Most primary forest cover, 2005. Tropical countries
| 1 | Brazil | 415,890 | ||
| 2 | Peru | 61,065 | ||
| 3 | Colombia | 53,062 | ||
| 4 | Indonesia | 48,702 | ||
| 5 | Mexico | 32,850 | ||
| 6 | Bolivia | 29,360 | ||
| 7 | Papua New Guinea | 25,211 | ||
| 8 | Suriname | 14,214 | ||
| 9 | Sudan | 13,509 | ||
| 10 | Madagascar | 10,347 | ||
| 11 | Guyana | 9,314 | ||
| 12 | French Guiana | 7,701 | ||
| 13 | Congo | 7,464 | ||
| 14 | Thailand | 6,451 | ||
| 15 | Ecuador | 4,794 | ||
Most “tropical rainforest”, 2005. These rankings are estimates.
| 1 | Brazil | ||
| 2 | Congo, Dem Rep | ||
| 3 | Peru | ||
| 4 | Indonesia | ||
| 5 | Colombia | ||
| 6 | Papua New Guinea | ||
| 7 | Venezuela | ||
| 8 | Bolivia | ||
| 9 | Mexico | ||
| 10 | Suriname | ||
| 11 | Guyana | ||
| 12 | Madagascar | ||
| 13 | French Guiana | ||
| 14 | Congo | ||
| 15 | Ecuador | ||
| 16 | Thailand | ||
| 17 | Malaysia | ||
| 18 | Panama | ||
| 19 | Guatemala | ||
| 20 | Nicaragua | ||
| 21 | Honduras | ||
| 22 | Laos | ||
| 23 | Philippines | ||
| 24 | Côte d’Ivoire | ||
| 25 | Belize | ||
Most number of native tree species, 2005. All countries
| 1 | Brazil | 7,880 | ||
| 2 | Colombia | 5,000 | ||
| 3 | Madagascar | 5,000 | ||
| 4 | Belize | 4,000 | ||
| 5 | Philippines | 3,000 | ||
| 6 | Bolivia | 2,700 | ||
| 7 | Malaysia | 2,650 | ||
| 8 | Zambia | 2,621 | ||
| 9 | Peru | 2,500 | ||
| 10 | China | 2,500 | ||
| 11 | Guinea-Bissau | 2,243 | ||
| 12 | Australia | 2,100 | ||
| 13 | Singapore | 2,013 | ||
| 14 | Brunei Darussalam | 2,000 | ||
| 15 | Myanmar | 2,000 | ||
| 16 | Zimbabwe | 1,747 | ||
| 17 | Mali | 1,739 | ||
| 18 | Lao People’s Democratic Republic | 1,457 | ||
| 19 | Togo | 1,451 | ||
| 20 | Venezuela (Bolivarian Republic of) | 1,360 | ||
The Democratic Republic of Congo should be on this list, but FAO does not have figures for this war-torn country.
Highest total forest cover as a percentage of total land cover, 2005. All countries
| 1 | Suriname | 94.7 | ||
| 2 | French Guiana | 91.8 | ||
| 3 | Micronesia (Federated States of) | 90.6 | ||
| 4 | American Samoa | 89.4 | ||
| 5 | Seychelles | 88.9 | ||
| 6 | Palau | 87.6 | ||
| 7 | Gabon | 84.5 | ||
| 8 | Pitcairn | 83.3 | ||
| 9 | Turks and Caicos Islands | 80 | ||
| 10 | Solomon Islands | 77.6 | ||
| 11 | Guyana | 76.7 | ||
| 12 | Finland | 73.9 | ||
| 13 | Guinea-Bissau | 73.7 | ||
| 14 | Belize | 72.5 | ||
| 15 | Northern Mariana Islands | 72.4 | ||
| 16 | Anguilla | 71.4 | ||
| 17 | Lao People’s Democratic Republic | 69.9 | ||
| 18 | Japan | 68.2 | ||
| 19 | Bhutan | 68 | ||
| 20 | Sweden | 66.9 | ||
Includes plantations, non-natural and degraded forests
Highest total forest cover as a percentage of total land cover, 2005. All tropical countries.
| 1 | Suriname | 94.7 | ||
| 2 | French Guiana | 91.8 | ||
| 3 | Micronesia (Federated States of) | 90.6 | ||
| 4 | American Samoa | 89.4 | ||
| 5 | Seychelles | 88.9 | ||
| 6 | Palau | 87.6 | ||
| 7 | Gabon | 84.5 | ||
| 8 | Solomon Islands | 77.6 | ||
| 9 | Guyana | 76.7 | ||
| 10 | Guinea-Bissau | 73.7 | ||
| 11 | Belize | 72.5 | ||
| 12 | Northern Mariana Islands | 72.4 | ||
| 13 | Anguilla | 71.4 | ||
| 14 | Lao People’s Democratic Republic | 69.9 | ||
| 15 | Bhutan | 68 | ||
| 16 | Cook Islands | 66.5 | ||
| 17 | Congo | 65.8 | ||
| 18 | Papua New Guinea | 65 | ||
| 19 | Malaysia | 63.6 | ||
| 20 | Dominica | 61.3 | ||
Includes plantations, non-natural and degraded forests
Highest total forest cover as a percentage of total land cover, 2005. All tropical countries excluding small islands
| 1 | Suriname | 94.7 | ||
| 2 | French Guiana | 91.8 | ||
| 3 | Seychelles | 88.9 | ||
| 4 | Gabon | 84.5 | ||
| 5 | Guyana | 76.7 | ||
| 6 | Guinea-Bissau | 73.7 | ||
| 7 | Belize | 72.5 | ||
| 8 | Lao People’s Democratic Republic | 69.9 | ||
| 9 | Bhutan | 68 | ||
| 10 | Congo | 65.8 | ||
| 11 | Papua New Guinea | 65 | ||
| 12 | Malaysia | 63.6 | ||
| 13 | Cambodia | 59.2 | ||
| 14 | Democratic Republic of the Congo | 58.9 | ||
| 15 | Colombia | 58.5 | ||
| 16 | Equatorial Guinea | 58.2 | ||
| 17 | Panama | 57.7 | ||
| 18 | Brazil | 57.2 | ||
| 19 | Zambia | 57.1 | ||
| 20 | Bolivia | 54.2 | ||
Includes plantations, non-natural and degraded forests
Total forest cover, 2005. All countries
| 1 | Russian Federation | 808,790,000 | ||
| 2 | Brazil | 477,698,000 | ||
| 3 | Canada | 310,134,000 | ||
| 4 | United States of America | 303,089,000 | ||
| 5 | China | 197,290,000 | ||
| 6 | Australia | 163,678,000 | ||
| 7 | Democratic Republic of the Congo | 133,610,000 | ||
| 8 | Indonesia | 88,495,000 | ||
| 9 | Peru | 68,742,000 | ||
| 10 | India | 67,701,000 | ||
| 11 | Sudan | 67,546,000 | ||
| 12 | Mexico | 64,238,000 | ||
| 13 | Colombia | 60,728,000 | ||
| 14 | Angola | 59,104,000 | ||
| 15 | Bolivia | 58,740,000 | ||
| 16 | Venezuela (Bolivarian Republic of) | 47,713,000 | ||
| 17 | Zambia | 42,452,000 | ||
| 18 | United Republic of Tanzania | 35,257,000 | ||
| 19 | Argentina | 33,021,000 | ||
| 20 | Myanmar | 32,222,000 | ||
Includes plantations, non-natural and degraded forests
Total forest cover, 2005. Tropical countries
| 1 | Brazil | 477,698,000 | ||
| 2 | Democratic Republic of the Congo | 133,610,000 | ||
| 3 | Indonesia | 88,495,000 | ||
| 4 | Peru | 68,742,000 | ||
| 5 | India | 67,701,000 | ||
| 6 | Sudan | 67,546,000 | ||
| 7 | Mexico | 64,238,000 | ||
| 8 | Colombia | 60,728,000 | ||
| 9 | Angola | 59,104,000 | ||
| 10 | Bolivia | 58,740,000 | ||
| 11 | Venezuela (Bolivarian Republic of) | 47,713,000 | ||
| 12 | Zambia | 42,452,000 | ||
| 13 | United Republic of Tanzania | 35,257,000 | ||
| 14 | Myanmar | 32,222,000 | ||
| 15 | Papua New Guinea | 29,437,000 | ||
| 16 | Central African Republic | 22,755,000 | ||
| 17 | Congo | 22,471,000 | ||
| 18 | Gabon | 21,775,000 | ||
| 19 | Cameroon | 21,245,000 | ||
| 20 | Malaysia | 20,890,000 | ||
Includes plantations, non-natural and degraded forests
More deforestation data
Afghanistan |
Albania |
Algeria |
American Samoa |
Andorra |
Angola |
Anguilla |
Antigua and Barbuda |
Argentina |
Armenia |
Aruba |
Australia |
Austria |
Azerbaijan |
Bahamas |
Bahrain |
Bangladesh |
Barbados |
Belarus |
Belgium |
Belize |
Benin |
Bermuda |
Bhutan |
Bolivia |
Bosnia and Herzegovina |
Botswana |
Brazil |
British Indian Ocean Territory |
British Virgin Islands |
Brunei Darussalam |
Bulgaria |
Burkina Faso |
Burundi |
Cambodia |
Cameroon |
Canada |
Cape Verde |
Cayman Islands |
Central African Republic |
Chad |
Channel Islands |
Chile |
China |
Colombia |
Comoros |
Congo |
Cook Islands |
Costa Rica |
Côte d’Ivoire |
Croatia |
Cuba |
Cyprus |
Czech Republic |
Democratic Republic of the Congo |
Denmark |
Djibouti |
Dominica |
Dominican Republic |
Ecuador |
Egypt |
El Salvador |
Equatorial Guinea |
Eritrea |
Estonia |
Ethiopia |
Faeroe Islands |
Falkland Islands |
Fiji |
Finland |
France |
French Guiana |
French Polynesia |
Gabon |
Gambia |
Georgia |
Germany |
Ghana |
Gibraltar |
Greece |
Greenland |
Grenada |
Guadeloupe |
Guam |
Guatemala |
Guinea |
Guinea-Bissau |
Guyana |
Haiti |
Holy See |
Honduras |
Hungary |
Iceland |
India |
Indonesia |
Iran |
Iraq |
Ireland |
Isle of Man |
Israel |
Italy |
Jamaica |
Japan |
Jordan |
Kazakhstan |
Kenya |
Kiribati |
Kuwait |
Kyrgyzstan |
Laos |
Latvia |
Lebanon |
Lesotho |
Liberia |
Libya |
Liechtenstein |
Lithuania |
Luxembourg |
Macedonia |
Madagascar |
Malawi |
Malaysia |
Maldives |
Mali |
Malta |
Marshall Islands |
Martinique |
Mauritania |
Mauritius |
Mayotte |
Mexico |
Micronesia |
Moldova |
Monaco |
Mongolia |
Montserrat |
Morocco |
Mozambique |
Myanmar |
Namibia |
Nauru |
Nepal |
Netherlands |
Netherlands Antilles |
New Caledonia |
New Zealand |
Nicaragua |
Niger |
Nigeria |
Niue |
Northern Mariana Islands |
Norway |
Oman |
Pakistan |
Palau |
Palestine |
Panama |
Papua New Guinea |
Paraguay |
Peru |
Philippines |
Pitcairn |
Poland |
Portugal |
Puerto Rico |
Qatar |
Réunion |
Romania |
Russian Federation |
Rwanda |
Saint Helena |
Saint Kitts and Nevis |
Saint Lucia |
Saint Pierre and Miquelon |
Saint Vincent and the Grenadines |
Samoa |
San Marino |
Sao Tome and Principe |
Saudi Arabia |
Senegal |
Serbia and Montenegro |
Seychelles |
Sierra Leone |
Singapore |
Slovakia |
Slovenia |
Solomon Islands |
Somalia |
South Africa |
South Georgia and the South Sandwich Islands |
South Korea |
Spain |
Sri Lanka |
Sudan |
Suriname |
Swaziland |
Sweden |
Switzerland |
Syrian Arab Republic |
Tajikistan |
Tanzania |
Thailand |
Timor-Leste |
Togo |
Tokelau |
Tonga |
Trinidad and Tobago |
Tunisia |
Turkey |
Turkmenistan |
Turks and Caicos Islands |
Tuvalu |
Uganda |
Ukraine |
United Arab Emirates |
United Kingdom |
United States |
United States Virgin Islands |
Uruguay |
Uzbekistan |
Vanuatu |
Venezuela |
Viet Nam |
Wallis and Futuna Islands |
Western Sahara |
Yemen |
Zambia |
Zimbabwe