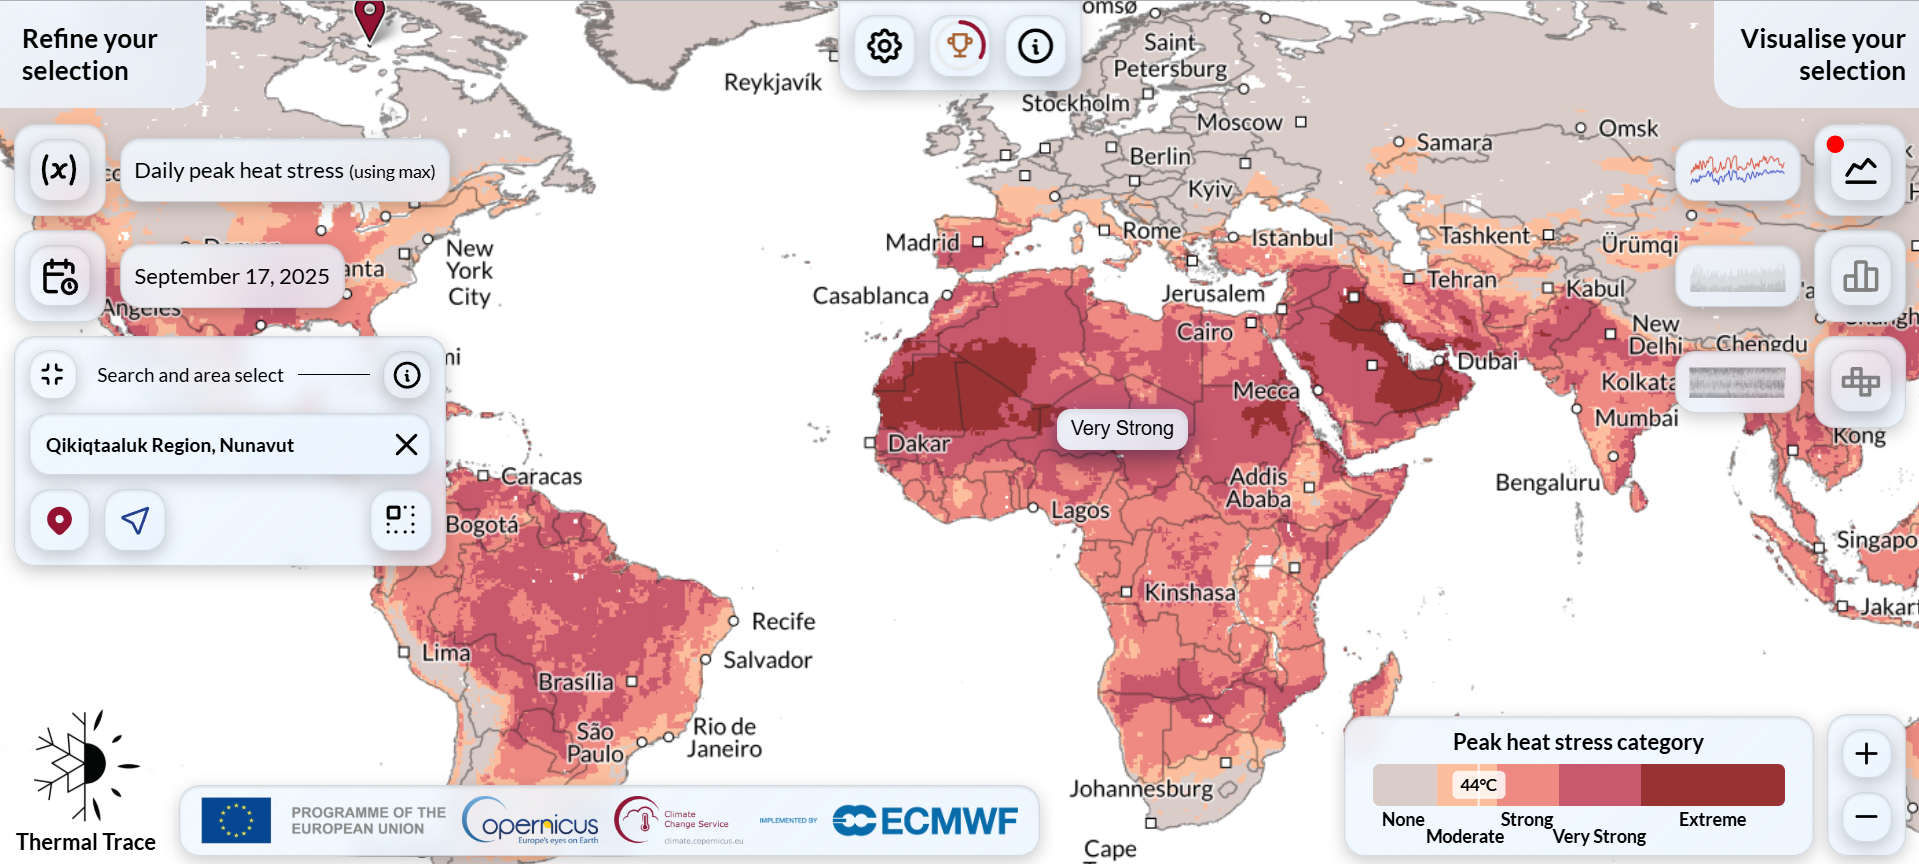
- The new Thermal Trace app allows users to explore thermal stress and related data from 1940 until five days before present, for anywhere in the world. The app, free for users, was developed by the European Copernicus Climate Change Service (C3S) and the European Centre for Medium-Range Weather Forecasts (ECMWF).
- Thermal Trace combines a range of metrics including ambient temperature, humidity, wind speed and more to come up with a “feels like” temperature that reflects the impact of heat and cold on the human body.
- Both heat and cold are physiologically stressful, and prolonged exposure can cause short- and long-term health impacts. Building up a greater awareness and understanding of heat stress and the harm it can do is especially important in our globally warmed world.
- Researchers warn that as climate change impacts accelerate, heat-related health impacts will become more serious and of especially grave concern to the parts of the world that reach the limits to human heat stress adaptation.
Wondering how this summer’s blistering heat or last winter’s bone-chilling cold snap compared with previous years? Or want to know how much heat stress climate change is bringing to your area — or in an area you’re planning to move to? There’s an app for that.
The new Thermal Trace app allows users to explore how both heat and cold stress are changing around the world. The app combines observed and modeled measurements of ambient temperature, wind speed, humidity and radiation along with a physiological model to come up with a “feels-like” temperature — a measure of thermal stress (which can feel far different than the temperature reading on your thermometer).
The data set stretches from 1940 until five days before present and can be visualized as maps, charts and graphs, or downloaded for free. Thermal Trace was developed by the European Copernicus Climate Change Service (C3S) and the European Centre for Medium-Range Weather Forecasts (ECMWF).
How hot does ‘hot’ feel?
Both heat and cold can be physiologically stressful, creating a sense of discomfort as our bodies strive to maintain a constant body temperature. They can also have profound short- and long-term health impacts, including death. As climate change impacts ramp up, heat waves are increasingly more intense and frequent, with heat becoming a major health concern around the world.
“It’s really important to monitor how much heat stress we’re seeing and how that is changing in different regions over time because it really has a clear impact on health,” explains Rebecca Emerton, a scientist at ECMWF and C3S. It is particularly important for people to be aware of how conditions are changing in their home territory and how to protect themselves from extreme heat when it occurs.
Emerton regularly works with researchers, international organizations, policymakers and others who want to incorporate climate data into their work. Those kinds of data sets are extremely large and difficult to get a hold of, she says.
She also fields questions on how heat waves compare with past heat events. “It’s hard to know that information off the top of your head or without doing a lot of data analysis,” Emerton notes. “We needed to be able to provide this kind of intuitive, easy access to the data and the information in a consistent global data set covering a long period.”
Thermal Trace isn’t alone. There are already several other apps that allow users to look at global climate-related conditions or trends. Copernicus offers several, including ERA Explorer, which lets users explore global historical climate; Climate Pulse, which provides near real-time global air and sea surface temperatures; and Interactive Climate Atlas, which lets users visualize past and projected global trends. Global drought monitoring is another useful app. With its addition of thermal stress data, the Thermal Trace app adds a human health dimension.

Thermal Trace is user-friendly
To explore the app and what its data can indicate health-wise, I dug into last summer’s headlines covering the devastating health impacts of the European heat wave.
Europe is the fastest-warming continent, and the summer of 2025 was its fourth-warmest on record. Across 854 large European cities, an estimated 24,400 people died of heat-related causes, with more than 16,500 of those fatalities due to warming from climate change, according to a recent analysis led by researchers from Imperial College London (ICL).
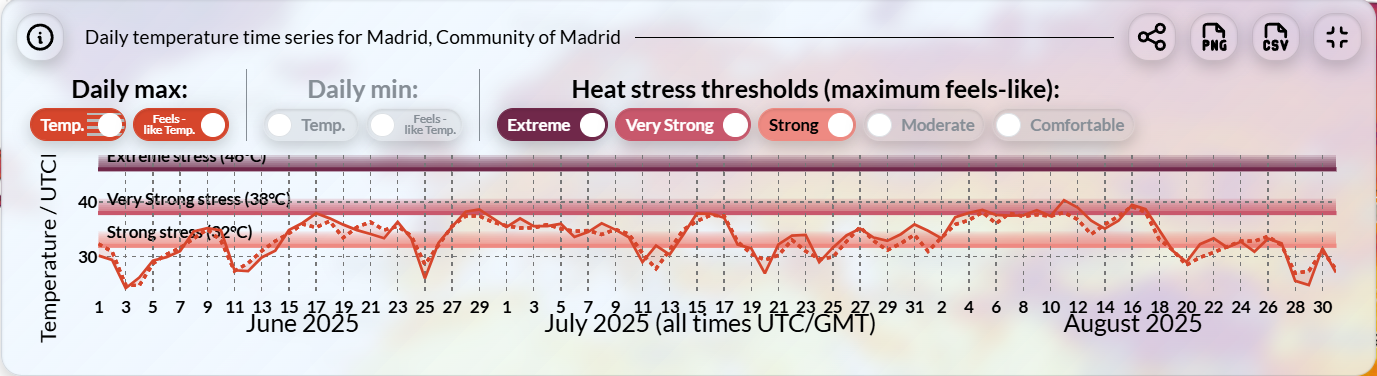
I decided to zero in on Madrid, one of the cities hardest-hit by climate change-related heat last summer, according to the ICL analysis. Using observed and modeled data, researchers found that between June and August 2025, 423 people in Madrid died of heat-related causes, and that 93% of those deaths wouldn’t have happened in a world without human-caused climate change.
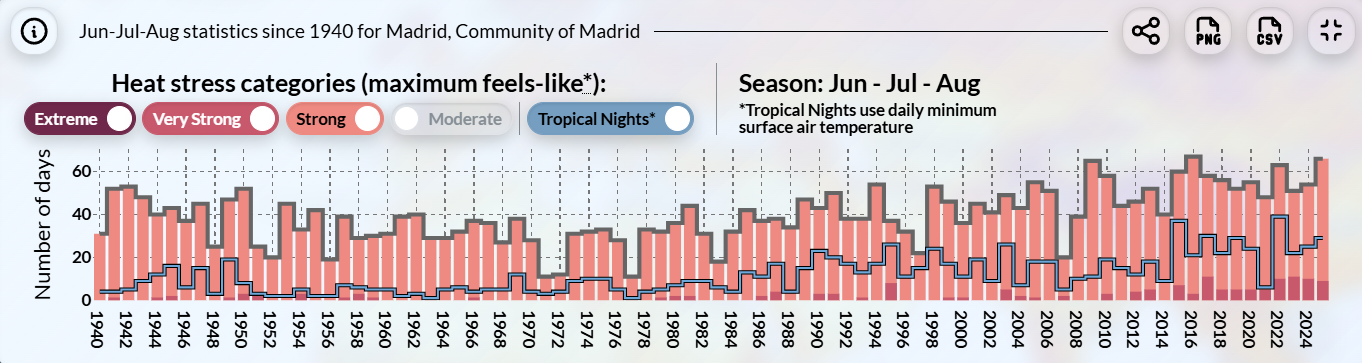
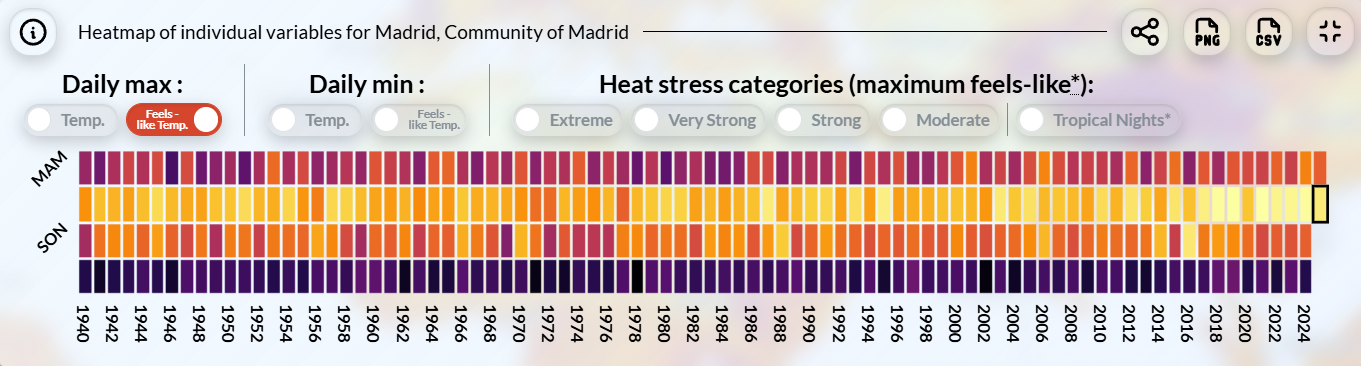
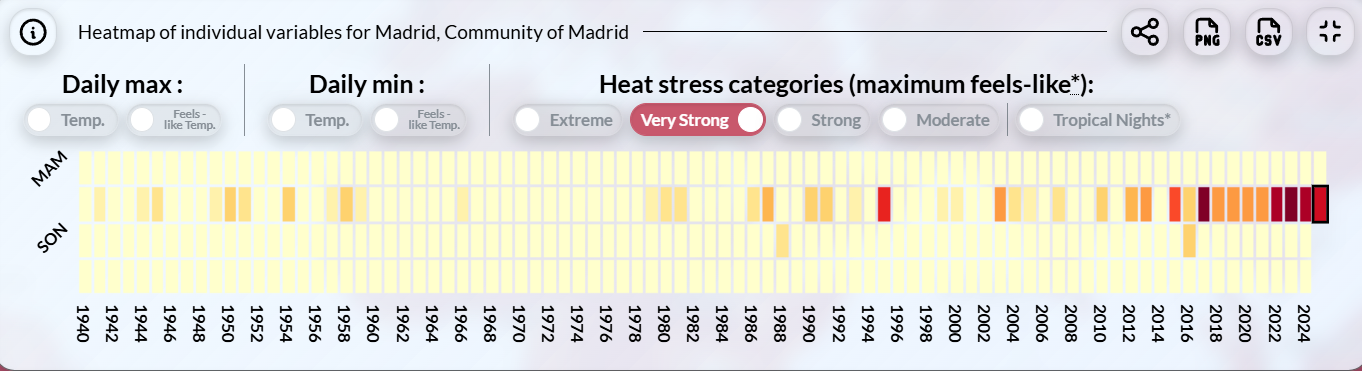
I typed Madrid into the Thermal Trace location search bar and set the time period to Jun, Jul, Aug. 2025. Various graphing icons on the right side of the screen allowed me to visualize the data and clearly showed the alarming uptick in the number of days of “strong” and “very strong” heat stress, along with tropically hot nights (when temps stay excessively warm overnight) in the past 15 years. Have a look below to see the results:
Track heat stress anywhere in the world
All Thermal Trace maps, graphs and data sets are freely available and can be downloaded. The app is easy to use, open-access and offers transparent data sets that “provide endless opportunities for different research from all across the global community,” Emerton says. And it’s an app you can use to get a clear idea of where your community is trending along the global heating continuum.
Planetwide, more than 5 million people die annually due to temperature-related causes, according to a 2021 Lancet Planetary Health study that looked at global deaths between 2000 and 2019. While that study found that cold-related deaths outnumbered heat-related deaths by a factor of 9:1, heat-related deaths increased by 21% over the study period, while cold-related deaths declined.
As climate change intensifies, there’s consensus among scientists that heat stress will be of growing concern, says Barrak Alahmad, senior research scientist at the Harvard T.H. Chan School of Public Health and a co-author on the Lancet study.
In truth, Alahmad says, most epidemiological studies only scratch the surface of heat’s true impact on human health. The majority look at short-term impacts, tabulating deaths within a few days of a certain temperature. That’s because time-stamped mortality data are much easier to access than tracking longer-term health impacts — the kinds of things that might weaken you, make you sick, lose income or shorten your life but not outright kill you.
One place to look for these sublethal impacts is among outdoor workers, Alahmad says. For example, his research in Kuwait, his home country, shows the devastating impacts of repeated daily exposure to heat stress on kidney function among migrant workers. “With time, we see there are 38-year-old men [regularly exposed to high heat] showing up to dialysis clinics,” he says.
To save the most lives, Alahmad emphasizes that society needs to not only focus on heat and heat stress, but also track impacts on its most vulnerable groups, including children, pregnant women, the elderly, those with low socioeconomic status (who are unable to afford air conditioning, for example) and those who work outdoors for a living.
To some degree, communities and individuals can adjust to heat or cold through infrastructure, clothing, behavior and physiology. The problem is that many places in the world are already reaching the limits to adaptation, Alahmad says.
“The real take home is that climate change is happening,” Emerton adds. “We’re watching the temperatures increase. We’re seeing the extreme events and … every fraction of a degree [we prevent] will help.”
But Thermal Trace and other apps can help tune us in to heat stress and other climate and weather pressures. So, take the app for a test drive and track your home territory’s changing heat- and cold-stress profile from 1940 to today.
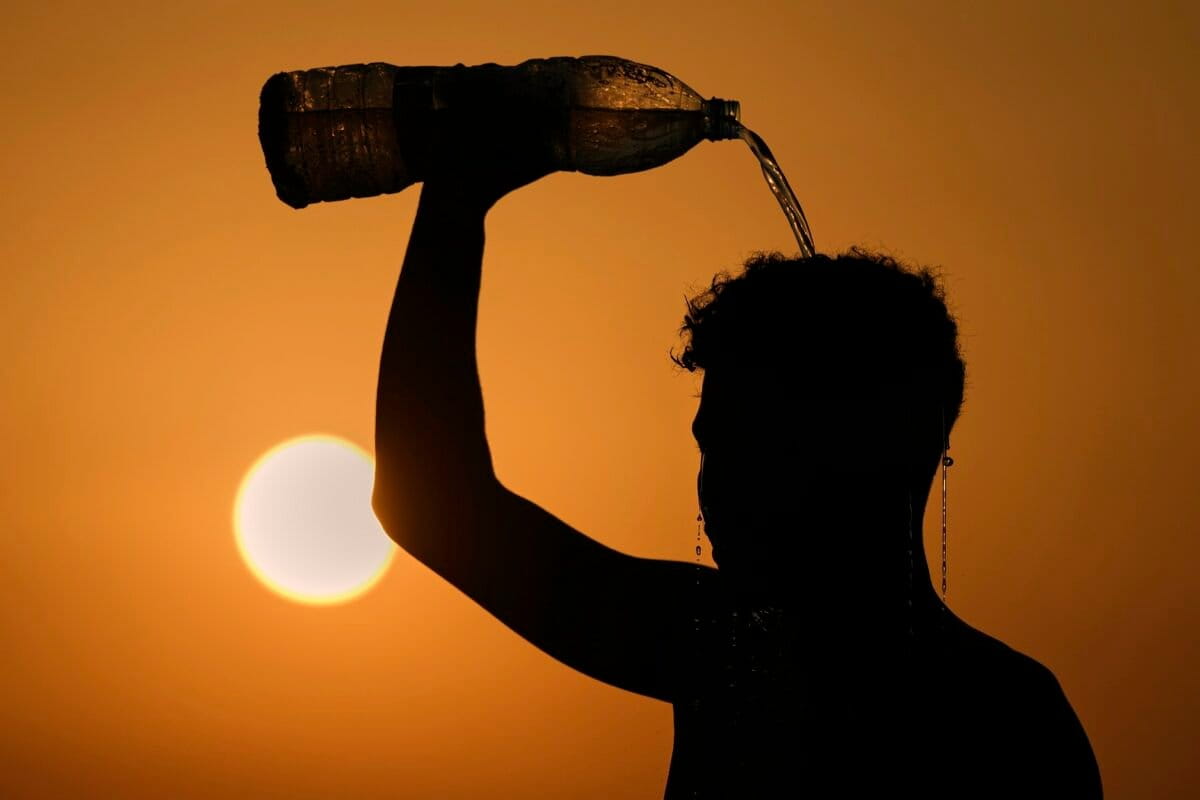
Banner image: After a game of beach footvolley on a sweltering hot day in Beirut, Lebanon, a man cools off by pouring water on himself. (AP Photo/Bilal Hussein)
Citations:
Imperial College London. (2025). Summer heat deaths in 854 European cities more than tripled due to climate change. Retrieved from Grantham Institute – Climate Change and the Environment website: https://www.imperial.ac.uk/grantham/publications/all-publications/summer-heat-deaths-in-854-european-cities-more-than-tripled-due-to-climate-change.php
Wu, Y., Li, S., Zhao, Q., Wen, B., Gasparrini, A., Tong, S., … & Guo, Y. (2022). Global, regional, and national burden of mortality associated with short-term temperature variability from 2000–19: a three-stage modelling study. The Lancet Planetary Health, 6(5), e410-e421.
FEEDBACK: Use this form to send a message to the author of this post. If you want to post a public comment, you can do that at the bottom of the page.