- The online mapping platform MapHubs stores maps and spatial data and makes them available to user groups for viewing, analyzing, and sharing with stakeholders.
- Users purchase a portal on the platform that allows the group to combine various public and private data sets in one secure place, produce maps, customize how the portal presents information, and receive support when needed.
- Groups have used the platform to identify deforestation from oil palm and cacao plantations and generate products such as time-lapse videos to show how regional deforestation can shift and expand.
Online mapping platform MapHubs has recently launched a new service, MapHubs Forest, which combines automated forest change visualization and alerts with tools for making maps online, analyzing spatial data, producing reports and storing information in a secure online portal.
The “hubs” of MapHubs are mini websites, or portals, that a company or other user group purchases for a project or specific topic, such as monitoring a national park in Côte d’Ivoire or land-use change around a set of oil palm concessions in Liberia. The group can use its portal, basically a customizable online space on the MapHubs platform, to upload, store and access information; create projects; assemble data; and produce data reports and maps.

The new forest reporting service allows the group to access forest change data and automated weekly GLAD alerts of tree cover loss, generated by the University of Maryland, directly from its portal and in combination with other spatial data sets. Companies or property owners can monitor tree cover at a scale of an individual farm, plantation, or project, and produce interactive maps of forest status.
This capacity would also help watchdogs, commodity traders, and investors verify that a company’s local suppliers are meeting international obligations, MapHubs founder and CEO Leo Bottrill told Mongabay-Wildtech.
“If companies are going to make good on their zero deforestation commitments,” Bottrill said, “they’re going to have to map and monitor at the farm level. If they don’t get to grips with their supply chains, they’re going to find themselves blocked from the European Union marketplace” due to the potentially high carbon emissions associated with oil palm and other industrial agricultural production.
Assessing land-use change around oil palm and cocoa production
As an example, MapHubs recently partnered with Feronia, a palm oil producer in the Democratic Republic of Congo (DRC), to monitor its concessions and provide maps as evidence of compliance toward its commitment to zero deforestation.
The company’s portal offers stakeholders access to the company’s land-use data, nearby logging concessions, REDD+ projects, protected areas, and other plantations, social investments such as health clinics and schools, and infrastructure, including roads.
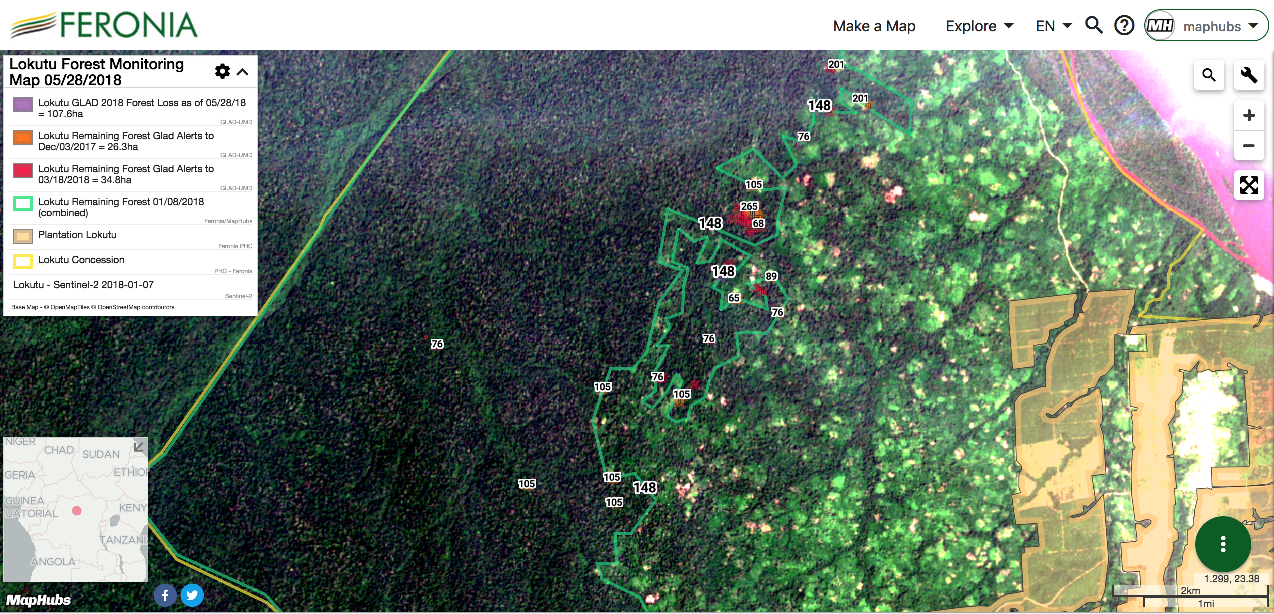
Through its portal, Feronia and its stakeholders receive regular reports on deforestation within its three concessions. It first used freely available Sentinel-2 satellite images to establish a baseline map of forest inside each concession.
The recently added GLAD deforestation alerts indicate where, when, and how much forest is lost within the forested areas of each concession. MapHubs verifies Feronia’s alerts with the most recent Sentinel imagery. It sends Feronia a forest report each month so the company can identify the areas being cleared and respond appropriately. Feronia creates maps and makes them publicly available.
“MapHubs helps us identify degradation hotspots around Feronia’s concessions and make maps to communicate landscape concerns to our investors,” Hugues Ekani, Feronia’s director of social and environmental responsibility, said in a statement.
The U.S. nonprofit Mighty Earth and MapHubs team have also assembled multiple map layers — including tree cover, tree cover loss, protected areas, roads, and settlements — from a variety of sources to assess the scale of deforestation in Côte d’Ivoire due to cocoa production.
The project quantified annual forest loss between 2001 and 2014 using a tree cover baseline map and areas designated as tree cover loss, both produced by the University of Maryland’s Global Land Analysis and Discovery (GLAD) lab. The MapHubs team aims to provide support when needed; in this case, it helped to recreate and check government maps of deforestation going back to 1990.
It then overlaid the tree cover map with a map layer of national protected areas and verified forest loss within Peko and Scio National Parks using high-resolution nano satellite imagery donated by satellite-imaging firm Planet. They traced features from DigitalGlobe’s premium high-resolution base map now available on OpenStreetMap to map roads and settlements inside the park, which confirmed that encroaching cocoa growers were driving deforestation.
Mighty Earth stored and managed the more than 50 map layers and 25 interactive maps for this project on the MapHubs platform, which lets users such as Mighty Earth find its information by keyword and group it by project, campaign, location, or other category.
“The first most useful thing [in using MapHubs] was helping pinpoint where I should go for my undercover investigation,” Etelle Higonnet, senior adviser at Mighty Earth, told Mongabay-Wildtech. “The second was being able to show the government authorities in time lapse videos how deforestation shifted and expanded, year by year. It was a game changer in our advocacy. Then I juxtaposed the deforestation maps with maps of rainfall loss to show how the two were connected, and it had an electrifying effect.”
Even the combination of image products the MapHubs platform makes available could not rapidly differentiate between plantations of cacao versus those for rubber or coffee, Higonnet said. This limited her team’s ability to quickly determine which tree crop commodity was responsible for specific deforestation.
Nevertheless, after several awareness-building campaigns, most of the cocoa industry has now pledged to largely end deforestation from cocoa production. Part of that pledge included a promise to set up a “joint monitoring mechanism” for Ghana and Côte d’Ivoire, which would include deforestation alerts in real time for the whole industry. If this collaborative monitoring really happens, Higonnet said, then the MapHubs platform could enable a rapid response to deforestation for cocoa.
Customizing online mapping
MapHubs Forest is meant to allow users new to geographic information systems technology, or GIS, to access various public data sets, upload their own spatial data in several formats, and combine them in one secure online location.
A group can combine several data sets to generate a forest report, which presents remaining tree cover, annual tree cover loss between 2001 and 2016, and GLAD alerts of loss. Users can verify loss by uploading high-resolution imagery, if they have access to it, or by overlaying loss with Sentinel radar imagery.
“Before MapHubs existed,” Bottrill said, “you would need to combine a GIS type of software system, you’d need to visit Global Forest Watch to view the alerts, you’d have to go to an imagery provider to find the images you need, you’d typically need a pretty highly trained GIS specialist, and possibly also a developer, someone who knows how to handle some aspects of coding, to pull this all together.”
MapHubs Forest offers the features at three levels of service, with higher levels aimed at for-profit companies in natural resources industries that want to verify their supply chains and identify risks on the ground.
- All customers can access and manage up-to-date forest change information from optical satellite imagery — the same data available on Global Forest Watch — upload their own content, and make maps. They can encrypt project information and offer specific people access to it.
- MapHubs provides mid-level customers access to the most recent freely available radar imagery from the European Union’s Sentinel-1 satellite and/or the integration of the user’s high-resolution imagery, and sends automated monthly project-specific forest reports for one or multiple properties.
- The premium version of the platform offers companies or groups interested in monitoring multiple locations an automated monitoring and ranking of the areas of interest by deforestation totals. It also offers data from the Digital Globe high-resolution satellite imagery for a group’s area(s) of interest.
Increasing transparency with cloud-based and on-the-ground monitoring
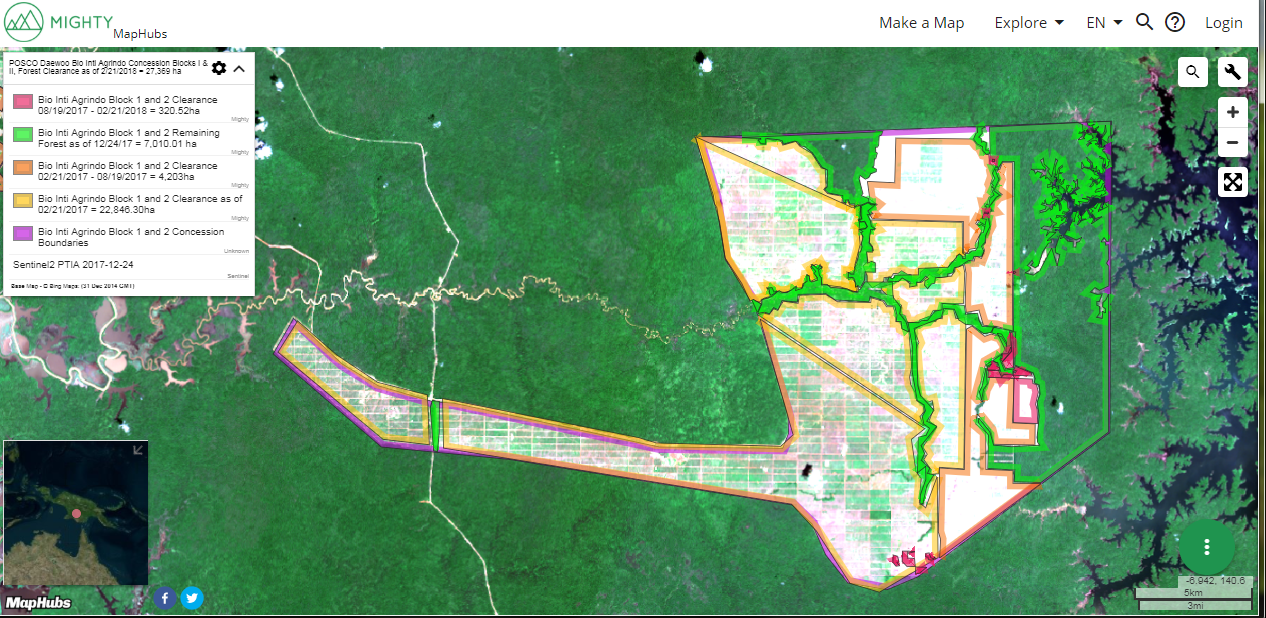
MapHubs and other online mapping products may increase transparency of activity by private agricultural and resource extraction companies. “Our maps were pivotal in stopping the highest deforesting oil palm concession in Indonesia [POSCO Daewoo] from clearing any further forest and getting Boots — the largest drugstore company — to end their business relationship with the plantation owner,” Bottrill said.

As part of the group’s focus on farm-level monitoring, MapHubs is currently developing a smartphone app that will sync with MapHubs Forest, Bottrill said. “It is a mobile version of MapHubs that lets you create monitoring layers, download alerts, and imagery, etc.” The app will be free to download but users will need a MapHubs portal to use it. Users can also upload georeferenced photos or data collected using another mobile tool such as Forest Watcher or Open Data Kit into MapHubs.
The mobile app and upload capacity offer users on the ground a method of assessing drivers of deforestation within a specific farm or plantation and incorporating social or other environmental information.
“I think we will see more platforms offering plantation level analysis because credible zero deforestation commitments depend upon it,” Bottrill said. “Some companies have invested in sustainability dashboards, which show certification commitments and perhaps mill level results, but ultimately, they will need to go further for full plantation-level disclosure.”