- Indigenous lands account for 36 percent of protected forests in Peru.
- In total, 42.6 percent of Peru’s forest fall under some sort of protection, and the new biodiversity maps highlight forest types that are underrepresented in that figure.
- The forests in the transition zone between the Andes and the Amazon appear to be the most in danger, as the forest types in this area are found at some of the lowest levels in Peru’s parks, reserves and concessions. This area also faces some of the highest deforestation rates in the country.
New maps of forest biodiversity in Peru illustrate the importance of lands held by indigenous peoples in safeguarding a wide variety of forest types, even as more formal protections such as parks and reserves fall a little bit short.
“Peru has a pretty good report card overall” in how the country protects its 76 million hectares (293,438 square miles) of forests, said Greg Asner, a global ecologist from the Carnegie Airborne Observatory (CAO) in Stanford, California, who led the research. The research found that nearly 43 percent of forests in the Andes or the Amazon benefited from some sort of protection.
But as Asner and his colleagues layered the data gathered from the skies above Peru with maps of the country’s local, regional and national protected areas, a “really surprising” conclusion stood out: “These indigenous lands are just critical in the portfolio of protections in Peru today,” Asner said in an interview. They published their research in the June 2017 edition of the journal Biological Conservation.

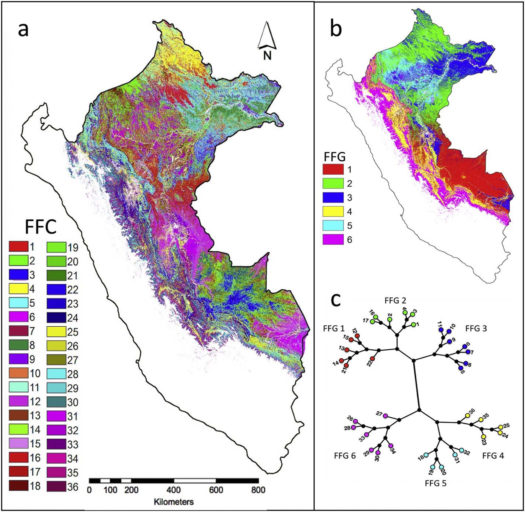
Back in January, Asner and his team reported that, from their measurements of the chemical signatures of different tree communities using an imaging spectrometer mounted on the CAO aircraft, they were able to parse out 36 different forest types – or what they called “functional forest classes” – that represent the forests of Peru. Their technique, called “airborne laser-guided imaging spectroscopy,” involves measuring the wavelengths of light reflected by the forest canopy and was developed at CAO.
What’s more, weeks of fieldwork confirmed that those communities they were observing from the air did in fact translate to unique mixes of trees on the ground.
“If you can map [functional forest classes], you’re mapping different communities of tree species,” Asner said.
For the Biological Conservation study, the researchers – some of whom work for the Peru’s Ministry of the Environment – combined this new storehouse of data showing the diversity of different forest classes with maps showing the various protected areas throughout the country.
Looking at both sets of data in concert afforded the team the opportunity to see which types of forest are best protected, where the gaps lie, and who is responsible for securing which areas, Asner said. Their findings provide a more accurate picture of what’s happening to forests, he said.
“These maps where they just throw down polygons of land ownership or tenureship are really biased and kind of lies by omission if they don’t resolve both what’s remaining in terms of standing forests and the type of forest that’s there,” he added.
“I’m trying to change that with this new approach.”

Now, that approach has revealed how much of each of the 36 forest classes is protected by the different levels of administration, and that’s where the importance of indigenous lands in the protection of Peru’s forest really crystallized.
Though indigenous lands didn’t include the biggest parcels, they do cover the broadest distribution of forest classes. They also accounted for more than a third of protected forests in the country. As might be expected, nationally administered protected areas tended to be the largest, but they also didn’t cover some forest classes nearly as well as others.
Asner pointed out that the level of detail this research provides brings more nuance to decisions about where to draw the boundaries of parks and reserves in a way that’s not solely focused on size.
“If it’s an area that has many forest types and it’s huge, then it’s really a good protection,” he said. However, “If it’s all the same type, then it’s not a very good protection, even if it’s a huge area.”
Regionally protected areas trended heavily toward protecting just a few classes of forest, the researchers found.
“I found that to be very revealing,” Asner said. “There’s just not enough investment yet in regional-scale conservation of large areas that have multiple forest types.”
He said their findings were a call to action.
“The regional governments need to really think about how they can contribute more,” he added. “Not everything has to be federal or indigenous.”

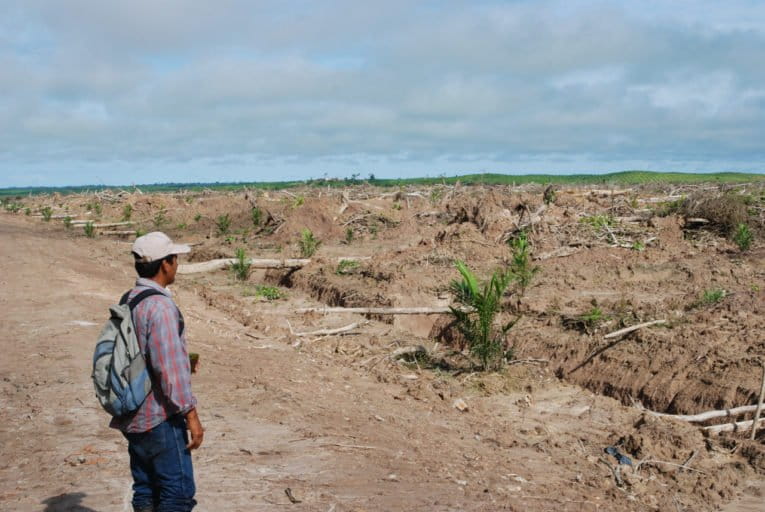
The team also noted that their research highlighted forest types that were both poorly protected and suffering from deforestation. In particular, much of the land that holds five classes that run from the base of the Andes into the fringes of the Amazon doesn’t fall within the boundaries of protected areas. These areas also suffer from the highest rates of deforestation in Peru, mostly the result of oil palm, ranching, and other types of large-scale agriculture.
“This suggests an elevated need for increasing protections” of these forest classes, write the authors.
One of the next steps in their research is to look at the connections between these protected areas and determine whether migrating animals could move easily between them. If the continuity is intact, that means that animals could move from areas that have been hit hard by agricultural development. Or, as the climate changes and some spots become hotter and drier, species sensitive to those changes could move to more hospitable climates.
But Asner is looking beyond just the forest biodiversity in Peru.

Currently, a significant limitation to how much area they can cover right now is that only one plane exists that’s outfitted to collect these kinds of data. Asner’s crew was able to take the plane to Borneo and fly over the Malaysian state of Sabah to map the carbon and biodiversity of the forests there. But he’s thinking much broader that one-off excursions.
“I hope this is an example of what can be done globally,” Asner said. To make that leap, he’s hoping to install his equipment on a satellite. It would be expensive – around $200 million – but the result would be maps of global forest biodiversity on a monthly basis.
And the momentum from people and organizations willing to back his goal is building, Asner said.
“I’m getting traction, and I’m getting it from places that are surprising.”

CITATIONS
- Asner, G. P., Martin, R. E., Knapp, D. E., Tupayachi, R., Anderson, C. B., Sinca, F., … & Llactayo, W. (2017). Airborne laser-guided imaging spectroscopy to map forest trait diversity and guide conservation. Science, 355(6323), 385-389.
- Asner, G. P., Martin, R. E., Tupayachi, R., & Llactayo, W. (2017). Conservation assessment of the Peruvian Andes and Amazon based on mapped forest functional diversity. Biological Conservation, 210, 80-88.
- Hansen, M. C., P. V. Potapov, R. Moore, M. Hancher, S. A. Turubanova, A. Tyukavina, D. Thau, S. V. Stehman, S. J. Goetz, T. R. Loveland, A. Kommareddy, A. Egorov, L. Chini, C. O. Justice, and J. R. G. Townshend. (2013). “High-Resolution Global Maps of 21st-Century Forest Cover Change.” Science 342 (15 November): 850–53. Data available on-line from:http://earthenginepartners.appspot.com/science-2013-global-forest. Accessed through Global Forest Watch on January 26, 2017. www.globalforestwatch.org
FEEDBACK: Use this form to send a message to the author of this post. If you want to post a public comment, you can do that at the bottom of the page.
