- With a view to providing a map of forest philanthropy, the Environmental Funders Network’s Forest Funders Group – an affinity group for foundations focused on forest conservation – has developed a methodology for describing forest grants by geography, focal issue, and approach.
- The mapping has been piloted on grants data submitted by five European-based foundations that made 652 grants between them in the study period (2011 to 2015), averaging £3.1m per year.
- Although this captures just a fraction of the forest grants made worldwide, it yields tantalising points for reflection.
- This post is a commentary. The views expressed are those of the author, not necessarily Mongabay.
“If you don’t know where you’re going, you’ll end up someplace else.” So said US baseball legend Yogi Berra, on the importance of having a goal in sight and a map for getting there. Those of us engaged in forest philanthropy — the investment of grants with the aim of protecting and replenishing the world’s forests — have well-formed ideas about the best places in which to seek change. Some funders focus on policy reform, others on shifting commodity supply chains, empowering communities, or direct conservation.
All of these approaches are valid. They and others besides will be needed to roll back deforestation. But if we accept it is possible to do too much of one thing and too little of another, or that some change-making activities are simply more reliant on philanthropic finance (adversarial campaigns or anything ‘too political’ being a case in point), we see that grant-makers would be wise to reference their strategies against choices made by other donors.
What is the flow of grant finance around specific issues, forest regions, and theories of change? Where do gaps and opportunities lie? How do forest programmes operated by foundations and governments compare? The total dollar value of forest philanthropy is much smaller than that associated with government-backed climate and development funds. But foundation grants can pack good bang for the buck — get it right and you maximise philanthropy’s potential for taking risks, building movements and pioneering change; get it less right and you could end up subsidising work that is already well-funded elsewhere.
A working knowledge of the grants market seems important if we are to lean towards effective philanthropy. But as it stands, forest grants are poorly mapped compared to the forest-related spending of government donors (including REDD+ pledges tracked at Climate Funds Updates) or the voluntary carbon market (tracked by Forest Trends).
With a view to providing a map of forest philanthropy, the Environmental Funders Network’s Forest Funders Group — an affinity group for foundations focused on forest conservation — has developed a methodology for describing forest grants by geography, focal issue, and approach. The mapping has been piloted on grants data submitted by five European-based foundations that made 652 grants between them during the study period (2011 to 2015), averaging £3.1m per year. (Full disclosure: I am a grants manager at JMG Foundation, one of the foundations included in the forest philanthropy mapping, and a committee member of the Environmental Funders Network.) Although this captures just a fraction of the forest grants made worldwide, it yields tantalising points for reflection, and we aim to run the mapping on a larger group of foundations this year.
The picture that emerges shows great variability between foundations, in terms of spending, investment priorities, and grantees. Overall spend is dominated by a small number of large grants (in this case, including four £1m+ awards), followed by a goodly chunk of funds in the £20,000 to £200,000 bracket, with a long tail of smaller grants (including 470 of less than £5,000 within this sample).
The five foundations dispersed funding to grantees based in 67 countries in total. More than half of these countries received less than one grant per year of the study period, via organisations based there (not counting grants directed to these countries but made via organisations headquartered elsewhere). By far the most grant spend (£12.4m, or 80 percent) accrued to large organisations headquartered in the UK and US, the majority of it geared towards protecting forests in tropical countries. This included work directly in those countries (such as training conservation leaders or developing sustainable livelihoods) and work geared towards international policy and markets (such as reforming the supply chain of forest-risk commodities).
FIG 1: GRANTEE HQ – TOP 10
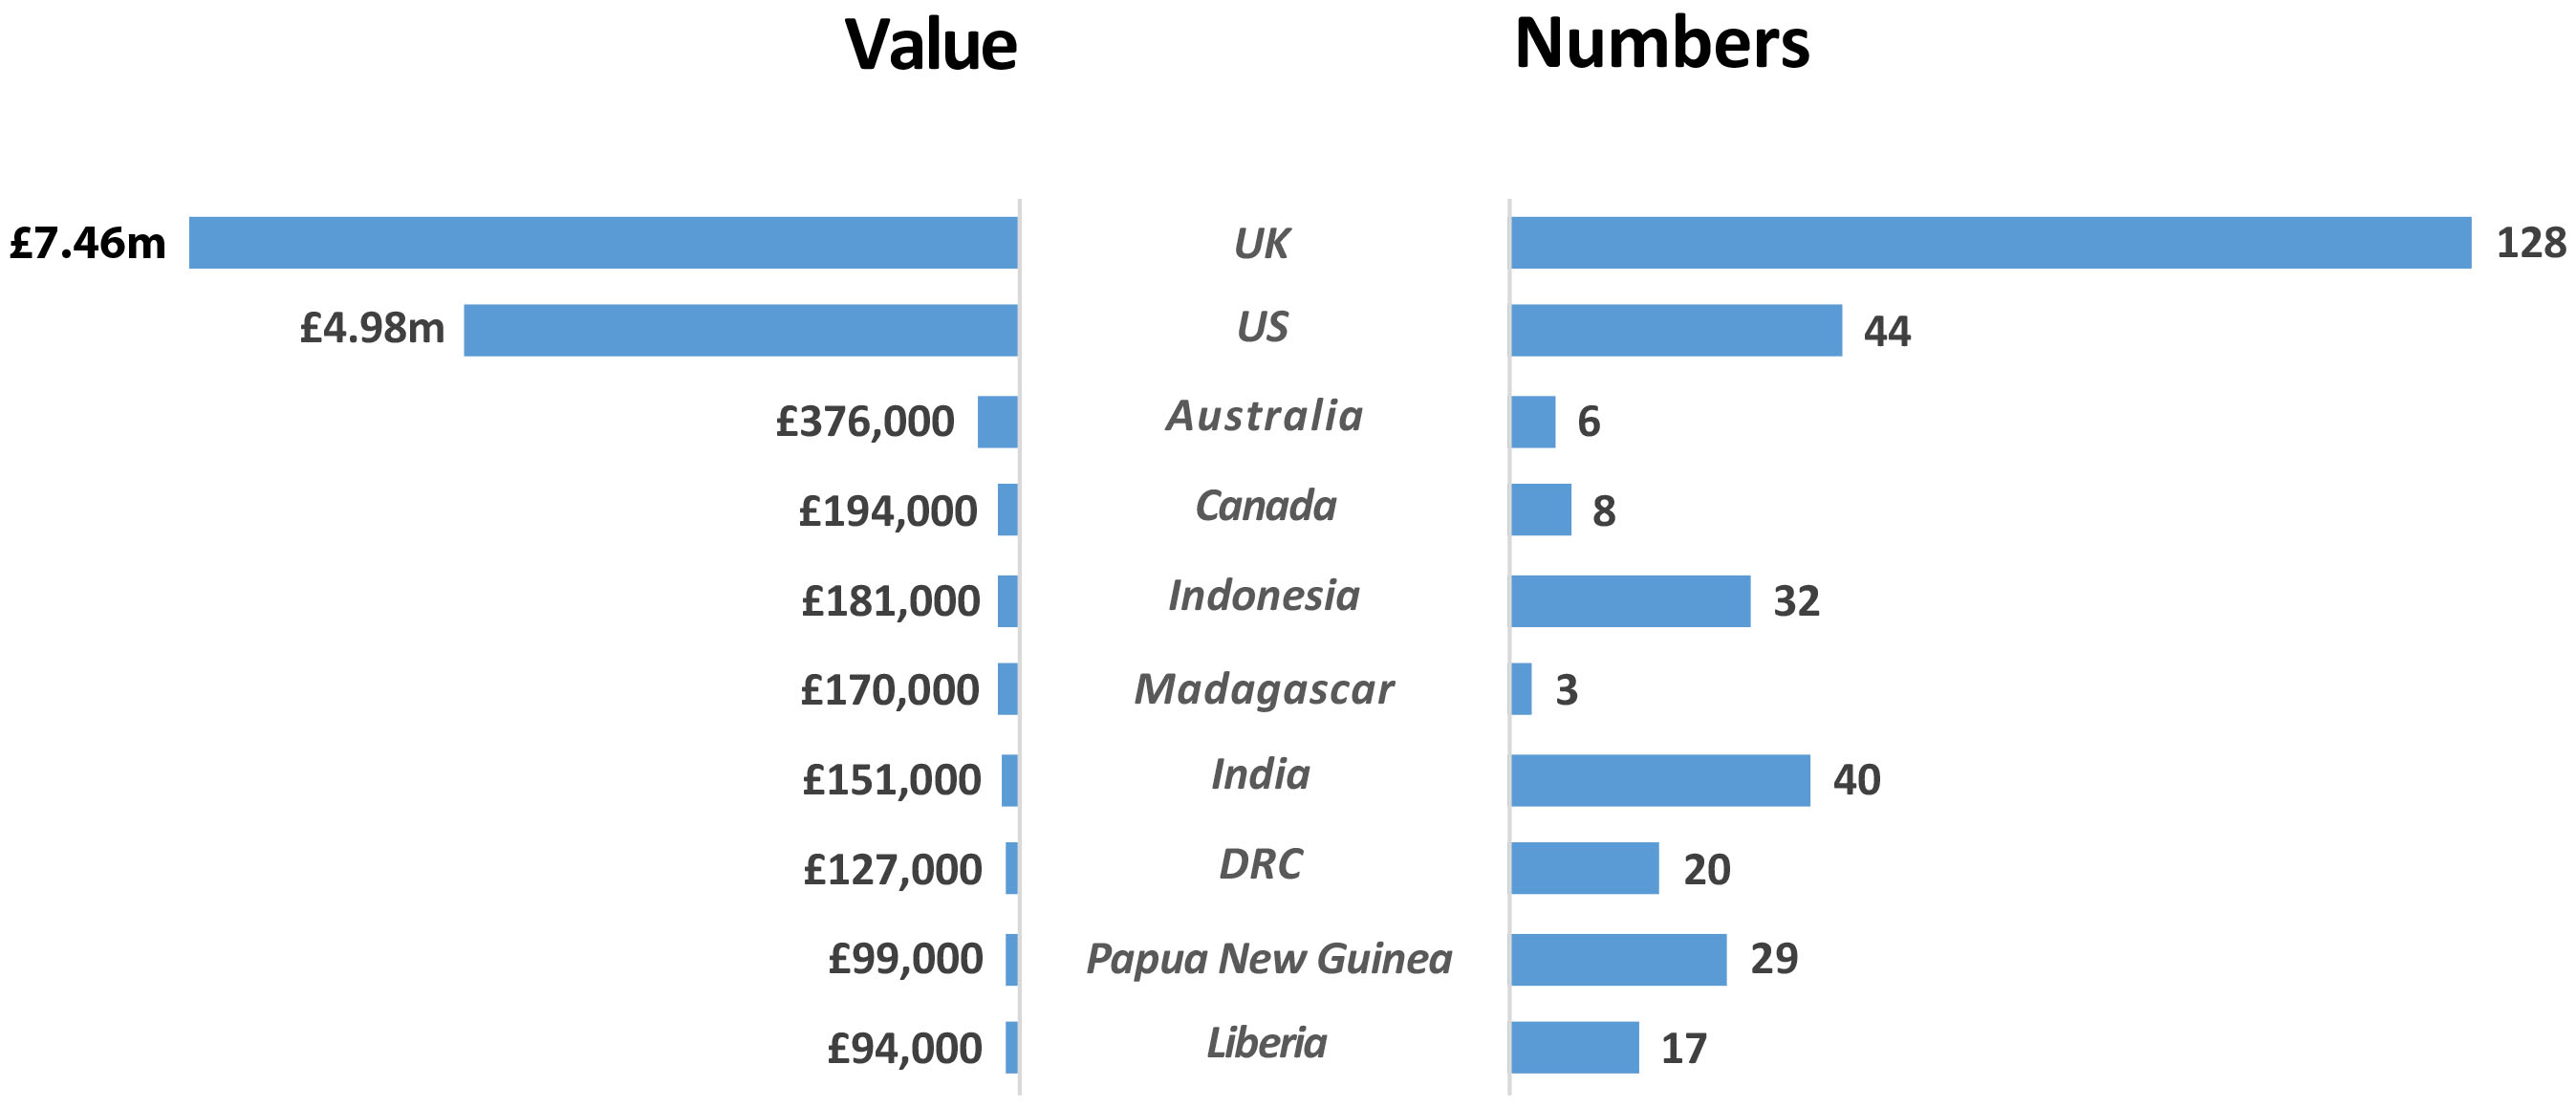
UK- and US-based groups received a lower proportion in terms of grant numbers (172 grants, 25 percent of the total), with the sub-£5,000 grants in particular tending to go directly to groups based in forest countries. India, Papua New Guinea, Russia, and Cameroon are among the countries in which there appears to be high demand for grants among local organisations, but relatively little funding available, at least among the set of foundations analysed here.
Again, these results pose interesting questions. Is the concentration of forest philanthropy upon a relatively small set of Western-based organisations problematic? What is the scale of re-granting going on from these international groups to their in-country partners? Should funders look to make more grants directly to NGOs based in forest countries? What are the barriers to doing so?
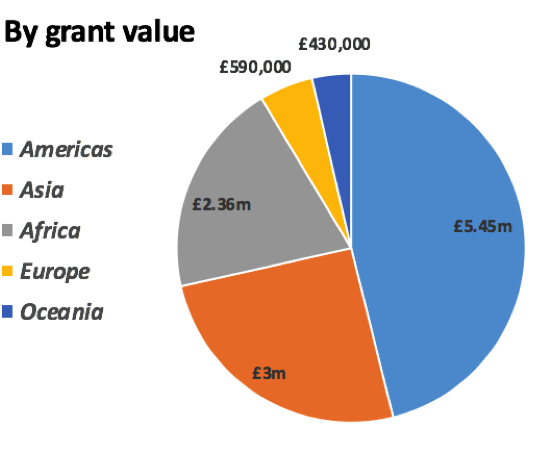
Turning to the forest regions prioritised by grantees, we see that one-third of grant spend (£5.2m) was directed towards South and Central America, one-fifth (£3m) to Asia and one-sixth (£2.4m) to Africa — of which less than £1m focused on the Congo Basin countries.
FIG 2: WORK LOCATIONS (CONTINENTAL REGION)
Grants were assigned to six issue categories: Landscape Change (including forest restoration, park management, REDD+, and climate adaptation work), Agricultural Conversion (where four out of five grants were related to palm oil), Forestry (grants to counter industrial and illegal logging, and reform the wood pulp sector), Local Use (sustainable farming and income generation), Energy & Extractives (mining, hydropower, oil), and Other Infrastructure (roads, ports, etc). Figure 3, below, shows the breakdown of grants between these categories, and Figure 4, below that, the average grant size per category.
FIG 3: FOCAL FOREST ISSUES
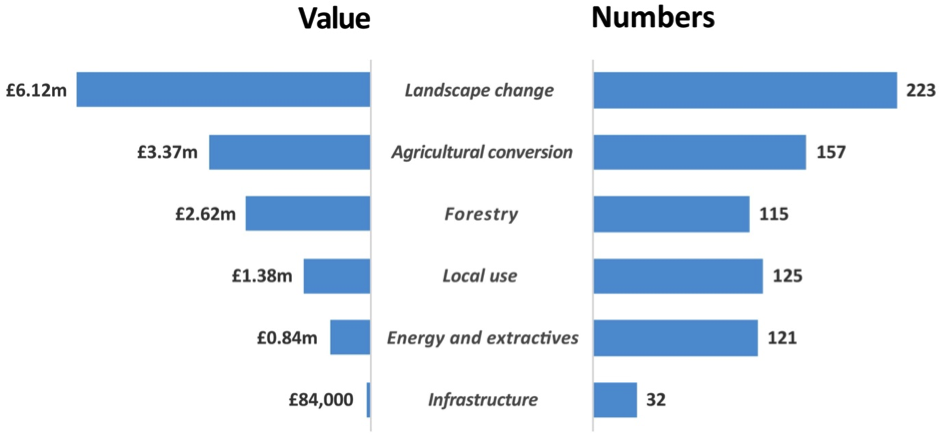
FIG 4: FOCAL ISSUES BY AVERAGE GRANT SIZE
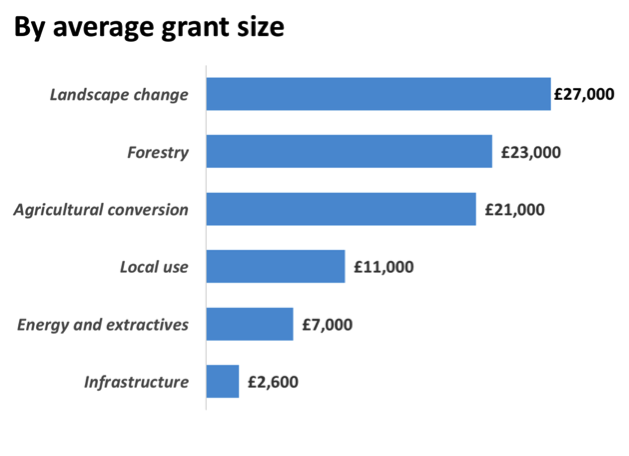
As we see, Landscape Change, Forestry, and Agricultural Conversion grants are relatively large and Local Use, Energy & Extractives, and Infrastructure grants much smaller — begging the question of what is a ‘useful’ scale for grant finance. On the surface of it, £11,000 may be enough to deliver a Local Use project, for instance a community forestry scheme (though probably not enough to scale that up at regional level). Equally, £7,000 might pay for some activism against mining or oil projects, but does not seem much to set against the powerful interests who tend to want Energy & Extractives projects delivered. Of course, some individual grants are larger than the average grant size, but in general the lowly sums available to counter damaging infrastructure schemes is striking.
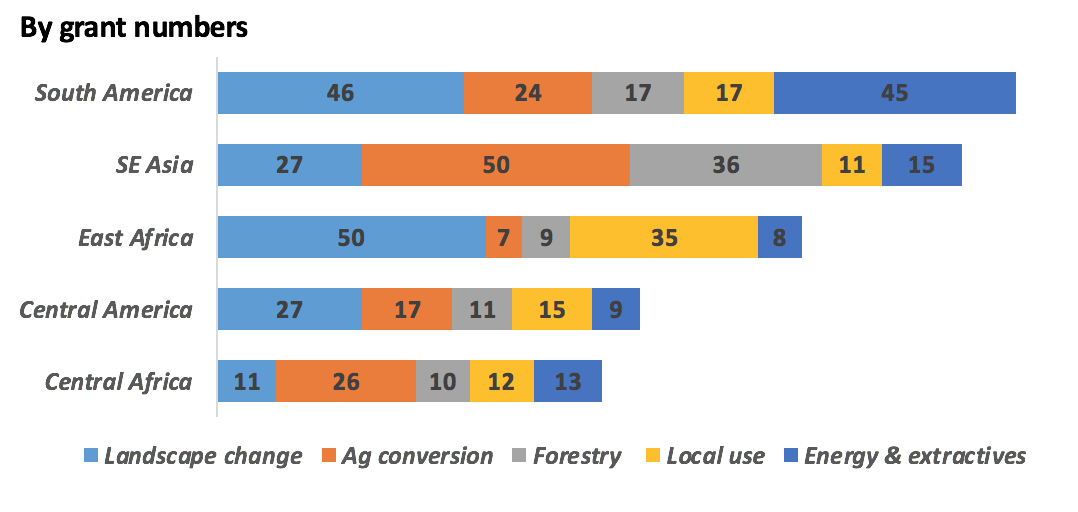
Figure 5 starts to tell the story of these issues at regional level. We see a large number of Agricultural Conversion and Forestry grants focused upon Southeast Asia, reflecting major campaigns to reform Indonesia’s palm oil and pulp sectors. South America received by far the largest number of grants on Energy & Extractives (though spending attached to the Landscape Change category was much higher), while Landscape Change and Local Use featured strongly in East Africa (including projects to promote sustainable land cultivation and reduce dependency on fuel wood).
FIG 5: ISSUES BY REGION
This analysis invites the question of how well forest grant allocation maps onto the real-world distribution of threats and opportunities. Take-home points from this dataset include the relative lack of funding directed towards the Congo rainforests, the dominance of palm oil among grants geared towards forest-risk commodities (far ahead of pulp, rubber, cattle, and soy), and a near-complete absence of grants targeted on non-energy infrastructure such as roads and ports.
Are philanthropies doing too much of some things and too little of others? The answer is for individual foundations to interpret and decide, but grants mapping exercises at least help to orient the discussion.

Harriet Williams is a grants manager at the JMG Foundation, where she heads up a program on tropical forests. She is a committee member of the Environmental Funders Network, whose mission is to increase the effectiveness of environmental philanthropy as well as the total funding directed to environmental causes. The JMG Foundation is a member of EFN’s Forest Funders Group, which carried out the grants mapping reported here. Follow EFN on Twitter: @greenfunders.
FEEDBACK: Use this form to send a message to the author of this post. If you want to post a public comment, you can do that at the bottom of the page.