- The MAAP project scours remote sensing data for areas of new deforestation and revisits known deforestation hotspots to highlight activities that cause forest loss.
- The project publicizes deforestation “stories” via a combination of several remote sensing technologies through its website.
- The team’s reporting of “just the facts” has prompted conservation action from government agencies, civil society and the media.
The Monitoring of the Andean Amazon Project (MAAP), launched in 2015 by the Amazon Conservation Association (ACA) and its Peruvian counterpart, Asociación para la Conservación Amazónica (ACCA), creates and presents maps from a near-real-time, high-resolution deforestation monitoring system. Matt Finer, who leads the project, initially came to ACA to help quantify threats to the Amazon—“instead of just saying oil drilling or dams are bad, quantifying impacts to see if and how they are bad”.
As Finer puts it, the MAAP team scours remote sensing data, primarily satellite images of varying resolutions, for new areas of deforestation and revisits known deforestation hotspots. Having seen the power of the timeliness of both monitoring and showing deforestation, the project focuses on high-resolution, high-frequency forest monitoring.
We spoke with Finer about the MAAP project and his team’s capacity to combine several new remote sensing technologies to monitor forest change in Peru. In a second part of this interview, we’ll highlight Finer’s thoughts on the rapid advance of technology in the remote sensing sector and its application to monitoring Amazon forests.
Wildtech: How and why did ACA start the MAAP project?
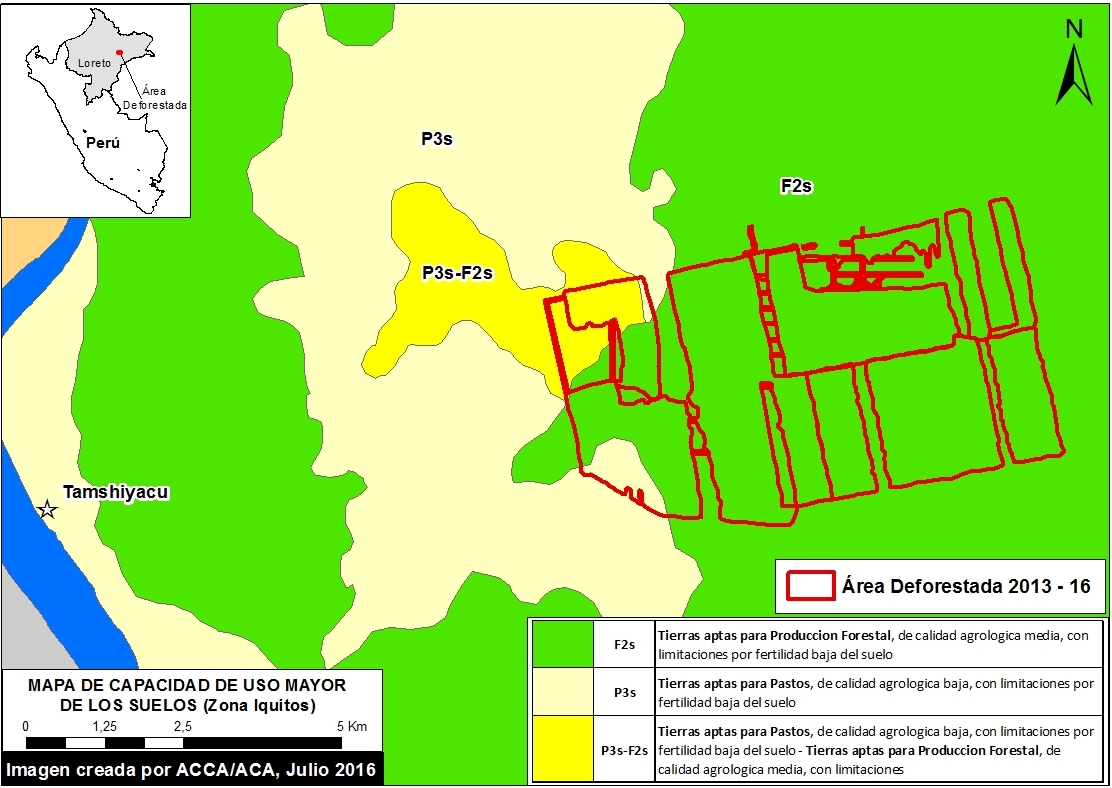
I’d just come from two years at the Center for International Environmental Law, focused on Loreto, Peru. While we were putting together a database on all planned and existing projects across all sectors, we got a tip that an oil palm company was starting to clear forest. We were able to look at the satellite imagery, and we could see a little bit of clearing in May of 2013. We continued to track it with a new sat image every 8 days, and that little clearing became 100 ha. We kept watching and it went to 300 ha, then 500 ha, and then 1500 ha. We basically watched a major deforestation event happen in near real-time. No one else was tracking it.

As the deforestation got to roughly 1000 ha, around September, as we got several clear, cloud-free images of these places that are really hard to get to, we held an emergency meeting with other NGOs in Iquitos. We met with a reporter from the La Region newspaper, who couldn’t believe it, and we broke this story over three days. La Region published some of our maps and satellite imagery. It’s not easy for everyone to wrap their head around, but we saw the power of near-real-time deforestation monitoring.
There is a big difference in saying two weeks ago, or this morning, this [deforestation] is happening. We really saw the power in being able to show that to a journalist or policymakers. The images really show the story themselves.
So the origin of MAAP was to take that experience and scale it up, with an emphasis on high-resolution, high-frequency monitoring, on the scale of days, weeks and months instead of years, but also using the historical data as a base. So then we can focus on what is happening these last couple of weeks and build off the historical and annual deforestation data sets.
Wildtech: Does a particular conservation question or mission drive how you use the different types of imagery?
We really are trying to let the data guide us, so we don’t have any particular agenda against any particular sector or company. We’re trying to identify the key emerging deforestation hotspots, so the average MAAP article is essentially a case study.
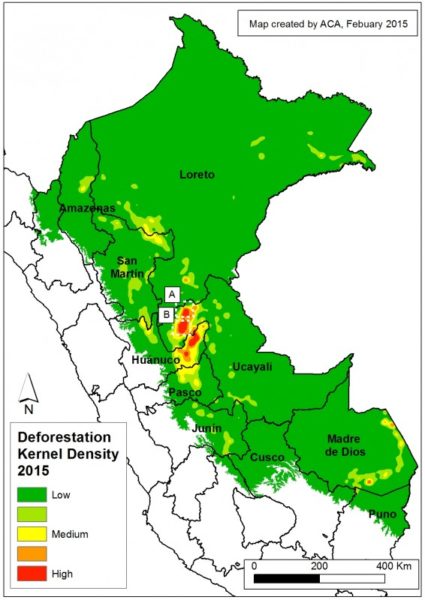
We’ve published 34 [now 39] analyses, and if you look at the data, there is a correlation between where the major hotspots are and where we’ve published. We’re trying to focus in on these hotspots.
One thing is to identify the key case studies, [such as] gold mining in Madre de Dios and United Cacao’s [illegal expansion] in Loreto. We try to use these deforestation hotspots to show us where we need to focus and do near-real-time monitoring and then every 6 to 12 months do a synthesis to understand the bigger picture patterns.
Wildtech: How large an area does MAAP cover?
For our first year, we’ve focused on Peru. Our latest was the first outside of Peru, in Colombia. The Andean-Amazon is the bigger picture vision, but for now we are in Peru, partly because there is so much going on, and there is still so much to track and to learn.
It’s a big area, and it’s still very much in play, in terms of how it’s going to look 50 years from now. There’s a bunch of protected areas and governments and still so much of a Wild West aspect to it. You still have gold miners invading protected areas and all this area where oil palm is invading from Southeast Asia. You [also] have this huge area in cacao, as African cacao plantations are crashing from disease. So you have this gold mining problem, this potential next frontier for oil palm, and it could [also] be [the] next frontier for cacao, and you still have illegal coca. [And] you have logging, which is hard to track because it’s usually selective, but now we can track roads.
So Peru is just a class-A case study, and we’re in no hurry to leave.
Wildtech: You seem to have nearly weekly satellite image updates available for some areas. Who analyzes the Landsat images?
I did it using [Carnegie Institution for Science’s] CLAS Lite [image analysis program] for [the] first year, and now, for Peru, the Global Land Analysis & Discovery (GLAD) alert system [part of Global Forest Watch] does it. My team still uses CLAS Lite for new projects in Brazil and Colombia.
We now have access to [high-resolution] DigitalGlobe imagery and PlanetLabs imagery. PlanetLabs uses “dove sats”–many little satellites with 3-meter resolution. So instead of [the U.S. government’s Landsat’s] 30-meter resolution images every 16 days, we get a 3-meter resolution every day.
We also have access to DigitalGlobe, which includes the Worldview 1 and 2 satellites, where we’re talking 50-cm resolution. If you look at our recent gold mining articles, those are a mixture of PlanetLabs and WorldView data.
A typical analysis is detecting forest loss using Landsat with GLAD or CLAS Lite and then zooming in and getting a better look with one of these two to try to determine the driver and producing more compelling graphics for a policymaker.
Wildtech: Tell us a bit about how your team uses these different data types to monitor forests in Peru.
With MAAP, our “methodology” is basically taking all existing technology and figuring out the best way to put it all together.
Landsat shows where there is forest loss but it’s hard to tell the driver, and at that resolution, it doesn’t really speak to the average person; it’s more of a technical tool. The big advance we’ve had at MAAP is access to the higher-resolution imagery.
The GLAD alert system analyzes all available Landsat images every eight days to get as much cloud-free imagery as possible. Each GLAD alert gives a pink splotch on a map. We then go back to the imagery and look at it to confirm what that pink splotch looks like on the image, to confirm [that it is deforestation].
For Peru, at this scale, there are hundreds of thousands of alerts. We get alerts for the whole country. At MAAP, we look at the bigger scale. We do recurring analyses that we know are stories, but another line of research is studying the raw data to see if there are any new hotspots or problem areas. Country-wide data every week is a game-changer.
You do still need a middle man between global-scale data and policymakers, to interpret the pink dots.
Wildtech: Do you need particular equipment to do the analyses?
The beauty of GFW is you just need internet. Anyone with a little training can learn to interpret the GLAD alerts and then download the appropriate Landsat image and look at it.
To go one step further and do what we do, you need ArcGIS, and you need a better computer to combine different types of data. DigitalGlobe and PlanetLabs aren’t freely available, but Landsat is geo-referenced and free to everyone. With the others, we worked out special agreements [so] that we have access.
Our methodology is integrating everything, and we do this in ArcGIS with the imagery from Digital Globe, Planet Labs, Landsat. You can import all this stuff into ArcGIS and combine the GLAD alerts with the Digital Globe or Planet Labs image, or with other map layers.
Wildtech: How do you put all the spatial information together?
We then write a concise description of the particular case in question and have somewhat of an internal review process, then an external review by Peruvian NGOs, under the umbrella of the regional environmental authority (ARA). Anything that deals with a protected area, we send to SERNANP [Peru’s protected area agency]. Now we’re expanding that a bit and share everything with MINAM, the environmental ministry. They can make a statement at the final product, but they can also make suggestions and comments on the post. And then we publish it [on our website].

Previously, I published one to two peer-reviewed papers per year but didn’t think that model fit for this. The whole idea of near-real-time monitoring is you gotta publish. You gotta get it out there. I try to get it out quickly, just the facts.
All this information is great, but the real point is to convey it somehow, so we try to make it into a story. I have colleagues that do most of the tech work, so my role is to put it all together and write that super-concise article. I try to keep it super-short and describe what’s happening with a series of three to four maps. We like to do a “Before” and “After.” We do a lot of what some place looked like two months ago and what it looks like now. It’s key showing what it used to look like. It’s like that with an oil palm plantation. You need to show how a couple of months ago it was primary forest, before it was an oil palm plantation.
Wildtech: What are your most important findings that would have been impossible without the use of technology?
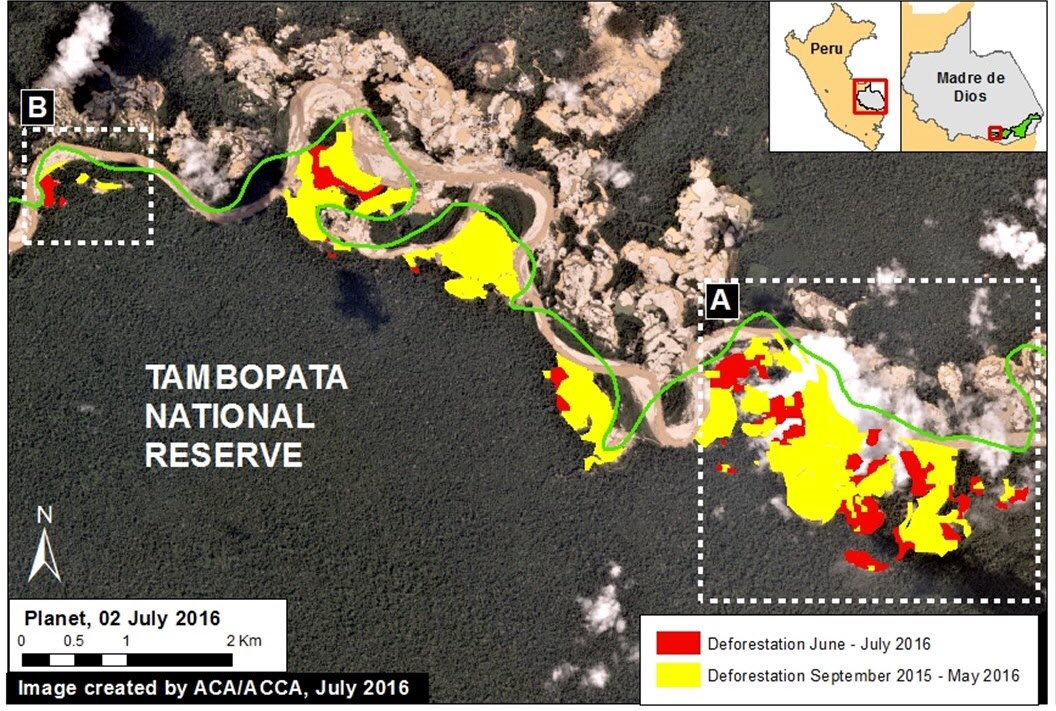
We documented the invasion [by gold miners] of Tambopata National Reserve, and more recently we documented that the miners are actually changing the course of the Malinowski River [see above].
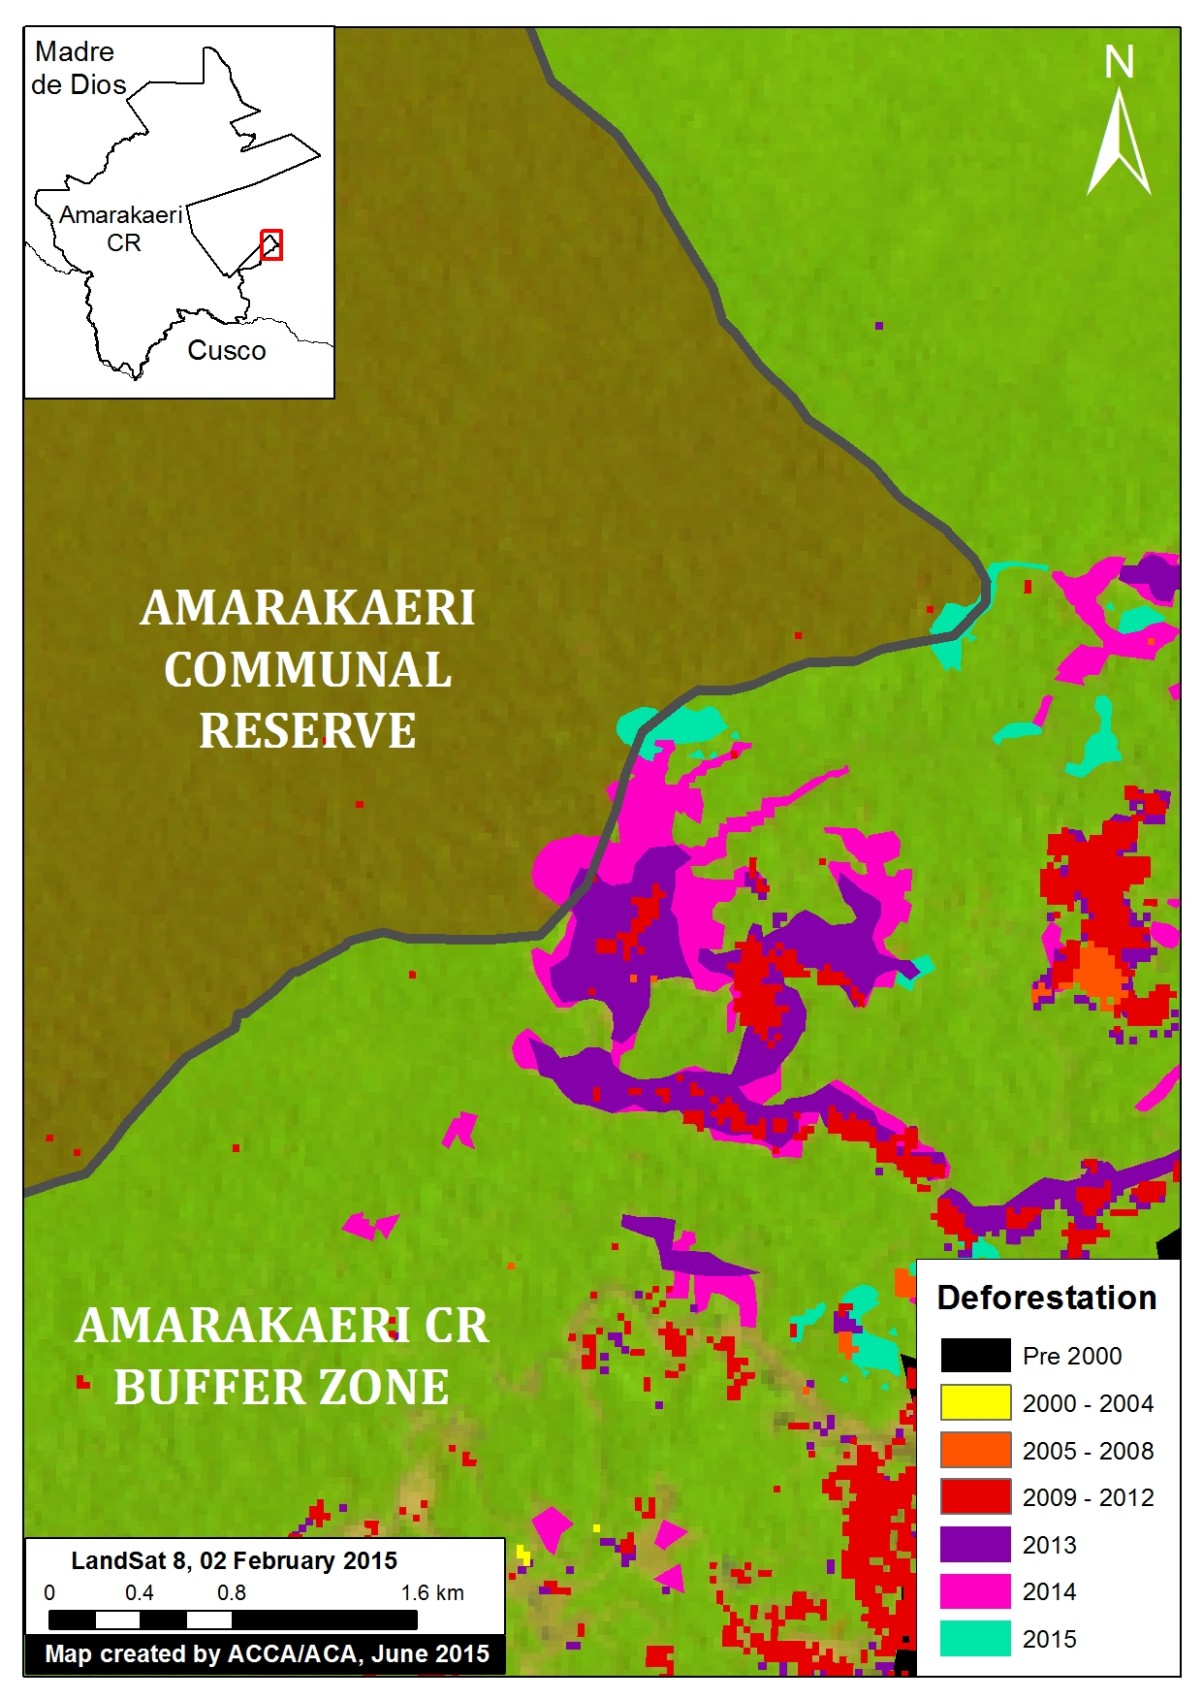
And gold miners had invaded Amarakaeri Communal Reserve. That was a big thing, in the early days of MAAP in May or June of 2015. It was in El Comercio and got big national attention. The protected areas agency and military were on the ground within 48 hours. The Peruvian government first doubted our findings, but then they went to the field and confirmed our findings. Then they took some measures to get the miners out of Amarakaeri and prevent future invasions. To this day, we haven’t seen any further expansion in Amarakaeri, so whatever they did worked.
We have been the main group tracking this whole United Cacao business since the beginning. Recently, Mongabay put out an article that the company still denies any deforestation, and you still have this old-school mentality of what life was before satellite imagery—one side basing an argument on all this technical information, and the other side saying, “Nope, it’s not happening.” They just say anything, and your average reporter gets confused and gives up.
Another big one is oil palm, an emerging threat to the Peruvian Amazon. There was a first RSPO complaint against an oil palm company in Peru, and our data was a major part of it. It was also a major part of RSPO’s response in issuing their precautionary measures, which used a Mongabay article using our data.
Wildtech: How have those insights been translated to on-the-ground management?
The immediate response to the article we did on gold mining in Amarakaeri is one case.
In Tambopata, they did have a system of military raids trying to deal with it, but the military comes in and does a raid in one place, people scatter and come back. Lots of people, nooks and crannies to have to look at. So now the military is trying to establish a more permanent presence and find a better strategy to deal with gold mining in Tambopata.
The Agriculture Ministry did an administrative action paralyzing the United Cacao operations, and the NGOs are using that as a basis of legal action. The Ministry used our information and their own in their case against United Cacao.
As I said, it’s been used in the RSPO case.
We were part of a growing drumbeat for creating Sierra del Divisor National Park. We showed there were illegal logging roads approaching the park and some deforestation in the park. They have more information now, and we are following up on these analyses now.
Over the next few years, we got some funding to improve the link between the technology side and the policy side. We want to establish a permanent working group in Peru focused on how to better develop policy based on this cutting-edge technology. It would be a shame to produce this amazing cutting-edge tech [and not have it be used]. It would be a government-NGO group to focus on that key question. That is the hard part. We are producing great stuff from technology but how do you more consistently apply that to policy?
Wildtech: Who are the key viewers of the images and web stories on the MAAP web site?
Whenever we post a new MAAP article, every 1-2 weeks, we send out that email blast, and it’s up to over 1000 people. It goes out in Spanish and English, because if you do only one, you lose half the audience. A good percentage of the Spanish audience is government folks. Peru has a lot of agencies, ministries and departments.
Some agencies get a sneak peek at the article, and then they get a personalized message when everything is up and they know it is public. They get advanced warning and have an opportunity to comment. If all we were doing was internal reports to the government, we’d see a lot less action. You need that at the end of the day they know that we’re going to publish it, make it public.
The email is the main way we get the information out. We have a baseline number of views per day, and on the days we send out the email, it spikes…so it works!
Wildtech: How feasible would it be to scale up the MAAP methodology to a broader area?
What we’re doing could be replicated anywhere in the world with forest cover, though access to PlanetLabs and DigitalGlobe, not everyone has that. We have access to Planet Labs through their ambassador [program]; for six-month time frames, you get access in exchange for being an ambassador and showing off how one can use it. We have access to DigitalGlobe through an agreement with USAID.
But everyone has access to Landsat imagery and GLAD alerts, and RADAR is now free, so if there was some algorithm, anyone could at least do the monitoring. Anyone can use the MODIS-based [FORMA] alerts as a guide and use CLAS Lite, but that analysis is at the scene level, so you have to pick where you’re going to focus.
In the bigger picture, what enables us to do what we do, is that this is what we do. I’ve got a four-person team. All we do is study deforestation, having this dedicated team, not making it third or fourth priority. It’s what we do, all day, every day.