- It is becoming easier to map and monitor extractive industries with intelligent manipulation and visualization of remotely sensed data
- Remote, real-time monitoring can be used to influence policy makers and brings a sharp increase in transparency for industry leaders
- “There’s a very real prospect that within the next few years we’ll be able to acquire high resolution visible satellite imaging at any point on the planet, daily”
When a buildup of hot gases and magma burst through the rock and ice covering Mount St. Helens in 1980, the ensuing eruption leveled huge swaths of the surrounding pristine wilderness. As a geologist analyzing satellite images of the blast’s aftermath, John Amos noticed a striking pattern: photographs from the blast zone showed whole stands of trees blown down by the eruption as far as the eye could see — a massive deforestation event — but when viewed from above, Amos saw a checkerboard pattern of clear-cut logging extending miles beyond the eruption’s wake. From the images, it was clear that the cumulative deforestation caused by our own management practices was worse than the apocalyptic damage of a historic volcanic event.
“We were vastly more powerful than nature in our ability to destroy forest, and the satellite imagery made that very clear to me,” Amos explained, recounting the damage. “I thought… it shouldn’t just be people with my skill set who get to see these stories and understand the impacts of how human activity and decision-making is systematically reworking the landscapes we all depend on.”
After analyzing satellite imagery for oil and gas exploration companies in the 1990’s, Amos decided in 2001 to lay the groundwork for what would become SkyTruth. The company gained traction when, after interpreting information from satellite images of the 2010 BP oil spill in the Gulf of Mexico, it was the first to publicly challenge the inaccurate reports of the rate of oil spilling into the Gulf. The non-profit company is now a leader in environmental remote sensing, combining open-source satellite images from Landsat and other systems to shine a light on the landscape-scale impacts of extractive industries around the world.
WildTech spoke with SkyTruth founder John Amos and Chief Technical Officer Paul Woods to learn more about the power of remote sensing for conservation and what the company is working on next.
WildTech: What triggered your realization that you could effectively use satellite data for environmental awareness?
John: I couldn’t take everybody up in the air to give them that perspective, so I decided the next best thing was to give people the aerial view using satellite imagery and remote sensing, the tools I knew. There’s a secret advantage that those tools have, which is we can time travel now with sat imagery. We can take people back decades to show them not only what the planet looks like now in this place, but what it looked like not so long ago — to reset the baseline.
Despite my technical skills at image processing and image analysis, I personally had no big data skills, so in the early days of SkyTruth when I was the only person, every project was a one-off. I would collect satellite imagery on a specific time and place, work on that, then I would publish something to our blog or our Facebook page and that would be a compact little story. Then Paul joined us and brought a whole new set of skills to the organization, which is allowing us to tackle much bigger data challenges that have global ramifications, rather than strictly local applicability. The greatest example we have right now is the Global Fishing Watch project we’ve done in partnership with Oceana and Google, which illustrates environmental issues not just with imagery, photographically, but with the intelligent manipulation and visualization of all kinds of geospatial data.
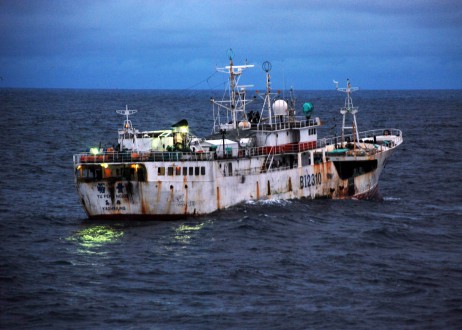
Paul: When I got to know SkyTruth , I saw some obvious applications for a lot of big data tools and software development – what SkyTruth needed was a way to automate John. While we can’t automate making the right choices, we can automate the imagery, the processing and doing all the work. That meant that we could have 20 interns to look at imagery and tell us when they see something interesting and then bring it to John for his analysis. So we did that, looking for oil spills around the world with [hundreds of] radar satellite images…. While we were doing this tracking, we stumbled across an oil slick created by a rogue vessel operator that turned into a major piece in the New York Times about crimes on the high seas. That led us to vessel tracking, and eventually Global Fishing Watch.

WildTech: Tell us more about Global Fishing Watch. How did the program start?
Paul: We started with the Global Ocean Legacy Program, tracking vessels around Easter Island and on the coast of Chile, and once we sort of mastered the techniques in a smaller region, we said, “Well, if we can do it in Chile, why not just do the whole world, right?” It’s just more data, it’s not a bigger problem. From a global feed of vessel tracking data, we got 250,000 unique vessels every month, of which 50,000 or so were fishing vessels, and we can process all of that data and find where the fishing activity is happening.
John: Right, once you have the data on vessel locations, you have to discern what the vessel is up to out in the middle of the ocean simply by studying its movement pattern. So that’s the magic at the heart of Global Fishing Watch: we are not just showing all of the movement history of fishing vessels, we’re actually extracting the times and places which our algorithms determine that crews put the gear in the water and are actively engaged in fishing. That simplifies things for human analysts. Human analysts don’t care if a vessel is in transit to determine if they are fishing legally or not: you just need to know when they’ve put gear in the water. If you’re a scientist who wants independent measures of fishing effort, you might be able to extrapolate into biomass estimates and by-catch estimates. Right now, you have to rely on data that’s provided by the fishermen themselves, which is extraordinarily hard to pry out of the hands of fisheries management around the world. So here we are providing an independent means to actually see and measure fishing effort. So that’s a real big data play, to extract that intelligence of the increasing cloud of data that we’re surrounding and smothering ourselves in in society today.
WildTech: Do you think we’ll see more platforms like Global Fishing Watch in the near future?
Paul: That’s where we see a lot of future potential — as thermal and image systems proliferate with Google Skybox, PlanetLabs Network and UrthCast, and new satellite imaging start-up companies that have plans to launch dozens and dozens of imaging satellites. There’s a very real prospect that within the next few years we’ll be able to acquire high-resolution visible satellite imaging at any point on the planet, daily.
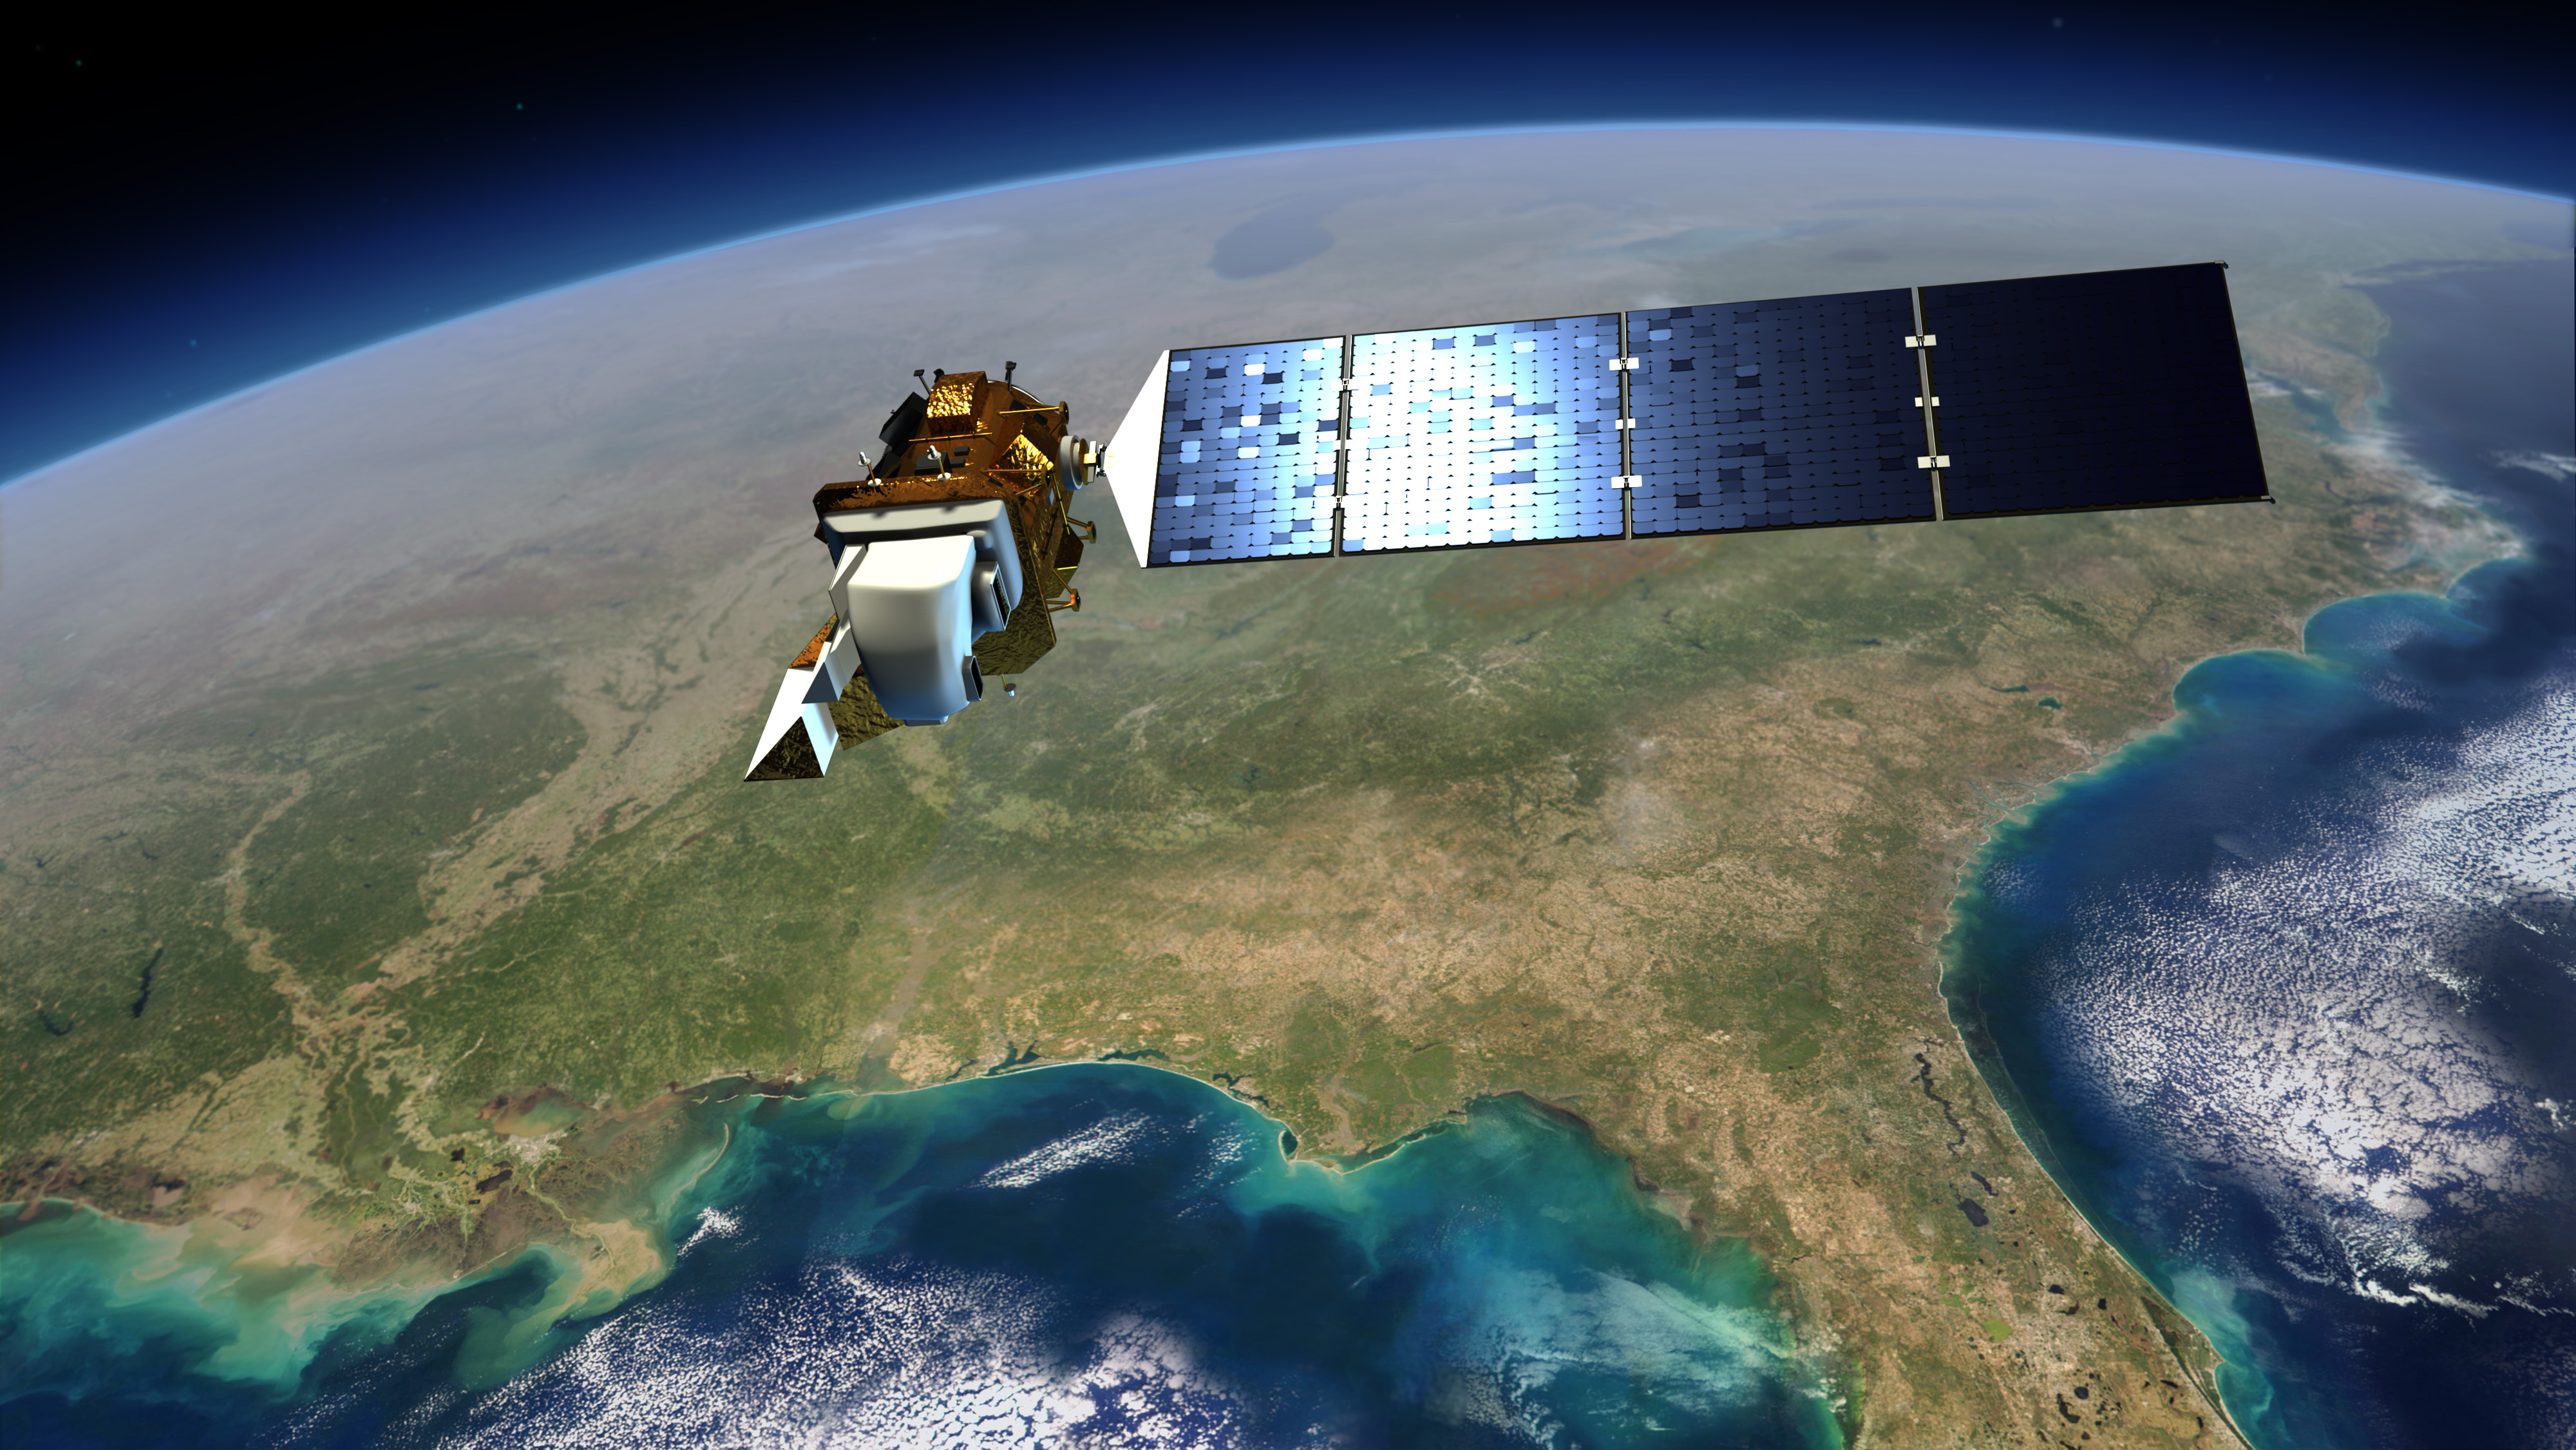
It’s wonderful and terrifying that suddenly, data access is not going to be a problem. When I was doing satellite imaging analysis for oil and gas exploration in the 90’s, there were just a handful of civilian satellite systems that we could draw from, and they were all outrageously expensive. I think one of NASA’s greatest unheralded accomplishments in earth observation is the Landsat satellites. Back when I was doing this commercially, a single Landsat image cost $4400! So there was no way grassroots environmental groups were even considering remote sensing satellite imaging as part of their communications and outreach to the public and decision makers. It was just priced beyond the moon for most people to think about.
Now you can access all four million Landsat satellite images through Google, interact with that fantastic Cloud storage archive and write your own programs to analyze whatever information you’re interested in. Now the hurdle is getting the information you need out of the data. That’s what we’re moving to as well — to take advantage of the abundance and turn it into actionable information for conservation.
WildTech: Thinking about how to process large amounts of data, could you explain how that process works in terms of Global Fishing Watch? How do you filter the data to create something that someone else can use?
Paul: So the basic challenge is: you take 100 billion data points, and, in two or three clicks, get down to the 10 that [the user] cares about. That’s the Google problem, and we write software to solve it. So first we need an expert that knows the problem. In Global Fishing Watch, we hired an expert to help us determine what would constitute fishing, what are local boundary lines and what regulatory information matters. We use that information to write software tools to acquire the data — often it’s in spreadsheets and PDFs or some other, horrible, hard to use format — and put it in a big cloud-based database. The key here is the visualization: how do you squeeze all of that data in and still give the user access to [both] the data and something intuitive? Global Fishing Watch figures out how to put it all on a map and gives you tools to move through it quickly to get the exact location and time that you’re interested in and see the raw pattern of the data without being exposed to all the detail of it.
John: Our main motivation here is to show people what’s happening in the environment and primarily things that are happening that are our fault…. Our primary motivation is to produce visuals that are consumable on the Web. In the past, we used to produce a lot of posters for public meetings and hearings and court proceedings, but increasingly that’s just moved to digital and interactive graphics on the Web. What we found is, once we’ve done all of the work we need to do to find, massage, process and analyze datasets to create a graphic like that, what we’re left with is a really useful piece of scientific data that other people might be able to do something interesting and fun with. I have to tell you, we’ve been extremely amazed and gratified at what has resulted from that approach.
WildTech: How do you ground-truth the data to make sure the algorithm is correct?
Paul: We actually have a heap of academics who are working on that problem of validating what we’re finding by seeing how it matches up to the other data sources that exist. The challenge, of course, is that the fisheries data is just terrible everywhere, so even if you go to the fisheries managers and you ask them for data in their fishery, it’s often really lousy. It doesn’t agree with itself.
WildTech: How about the rest of the conservation community? How can others replicate what you’re doing?
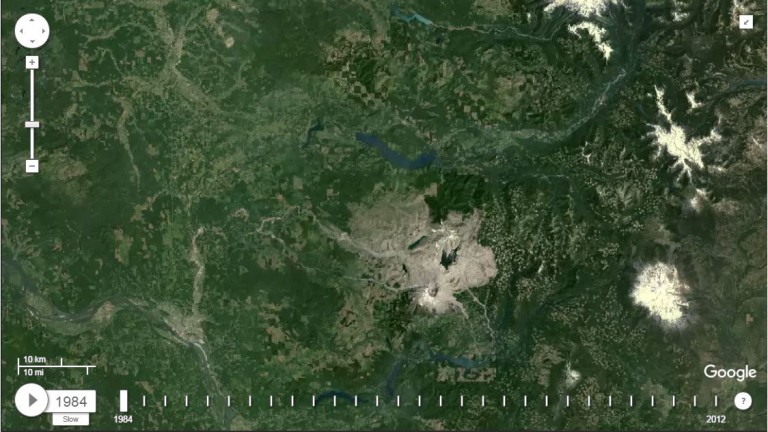
John: To some extent, our expertise and our experience give us the ability to do some things that the ordinary person or non-expert really might not be able to do, but for a lot of simple investigations, our go-to tool is Google Earth. We hear about some mining operation in the middle of Africa, and the first thing I’ll do is dial it up in Google Earth and take a look. It’s just amazing how often that alone produces some very interesting stories. Then you [can] combine them with some of the other publicly available tools that are out there like TimeLapse that has taken advantage of the 4 million Landsat images of the planet going back to the early 70’s and allows you to dial up any place on the planet and run an animation of satellite images showing how it’s changed over 40 years. We also want people to be able to look over our shoulder. We’re not unbiased brokers of information because it’s our belief that by producing these visuals, we will encourage more people to take an active interest in the environment and then ultimately, the outcome of that is stronger policies for environmental protection and stronger political will for environmental protection around the world.

WildTech: What new remote sensing analyses do you envision in the next two to five years?
John: In terms of really exciting, interesting and technically challenging stuff, there’s been a proliferation of new satellite systems that are going to have us drowning in high-resolution satellite image data, acquired daily, if all goes well. Space is still complicated. Every now and then, stuff still just blows up. It’s still complicated and risky, but the thing about the new wave of Cubesats or ‘Mini satellites’ is that they’re cheap. Rather than costing half a billion dollars, it costs tens of thousands of dollars or less to build one of these little satellites. So you can build a lot of them, and you’re not doing anything to change the launch failure risk, but if it fails, you’ve got a warehouse full of these things, so you can roll them out and try again.
We’re confident there’s going to be this new era of high-resolution imagery, and one of the things we want to do is automate the process of using the lower-resolution free systems to detect events that we want to investigate with a higher-resolution systems. In the intelligence world, they call this ‘Tipping and Cueing,’ where you use a reconnaissance-level system to scan the world at a low level of detail and detect changes that you may want to target a higher-value asset on.
WildTech: Can you give us as an example of how Tipping and Cueing might be used?
John: So a tangible example of this for us is the spectacular Global Forest Watch (GFW) tool that was built by Google and the World Resources Institute. GFW is now able to produce 30-meter resolution global maps of forest cover every year, and in between those annual maps, they have FORMA Alerts — deforestation alerts that are detected using free, much lower-resolution, twice-daily satellite imagery from NASA. The lower-resolution images are great because you can analyze them much more frequently to detect forest disturbances that are occurring in between the annual updates. But because of the lower resolution, the alerts can’t tell you what the disturbance was. Was it just a lightning-sparked wildfire or a storm-induced blow-down of trees, or was it illegal loggers that snuck into this reserve and cut down a thick patch of mahogany?
So there’s an example where we would love to build a process to filter FORMA alerts be more than geography of interest. Then you can automate the programming and acquisition of high-resolution imagery for FORMA events which justify further investigation. In this case, that might be with Google Skybox satellites to collect some 1-meter high-definition video of the site from space to see if there are vehicles moving around that site and they’re dragging logs — you might have an illegal logging operation going on there, or there’s nothing happening, so it must have been a one-time blowdown event. So that’s where we are certain things are going, that there will be increasingly automated detection of events that might be significant, followed up by the automated acquisition of imagery that will allow you to identify whether that event really was significant or not.
WildTech: Do you have any tips for aspiring conservationists interested in working with spatial or remotely sensed data?
Paul: Learn to code in Python! Go to Code Academy and learn how to write code.
John: Learn to code in Python and then call us. We have some big juicy projects that we need help with. We want a heck of a lot more coding for conservation, because you know, it’s just amazing that there’s this proliferation of tools that make it easier for people to access and use satellite imagery, and the field is growing by leaps and bounds as we conceive of more things that are now becoming possible in technology. So we need more coding to take advantage of that.
If you’re not a coder, I’d say the next most important thing to do is get Google Earth Pro. You can start importing other geospatial datasets into Google Earth and overlaying them. So if you’ve got field data showing camera trap occurrences of tigers in your study area, and you want to quickly and easily know if there is any pattern to the fauna or topography or hydrology of that area with the occurrences of tigers in the study area, you can easily bring that information into Google Earth, overlay it and explore it in combination with satellite imagery — and not just today’s satellite imagery, but historical imagery to see if there’s some landscape change that’s driving patterns of tiger occurrences. There are all kinds of fascinating stuff you can do right now, for free. Play with it; it’s fun as hell.
Do you use remote sensing data in your work, or are you interested in incorporating free satellite data into current research? Comment below or head to the Remote Sensing Forum to share your stories and questions.
John Amos will be speaking at WWF’s Fuller Symposium in Washington, D.C., on November 18th. You can stream his keynote speech here, along with other talks by scientists and tech developers harnessing new technologies for conservation.