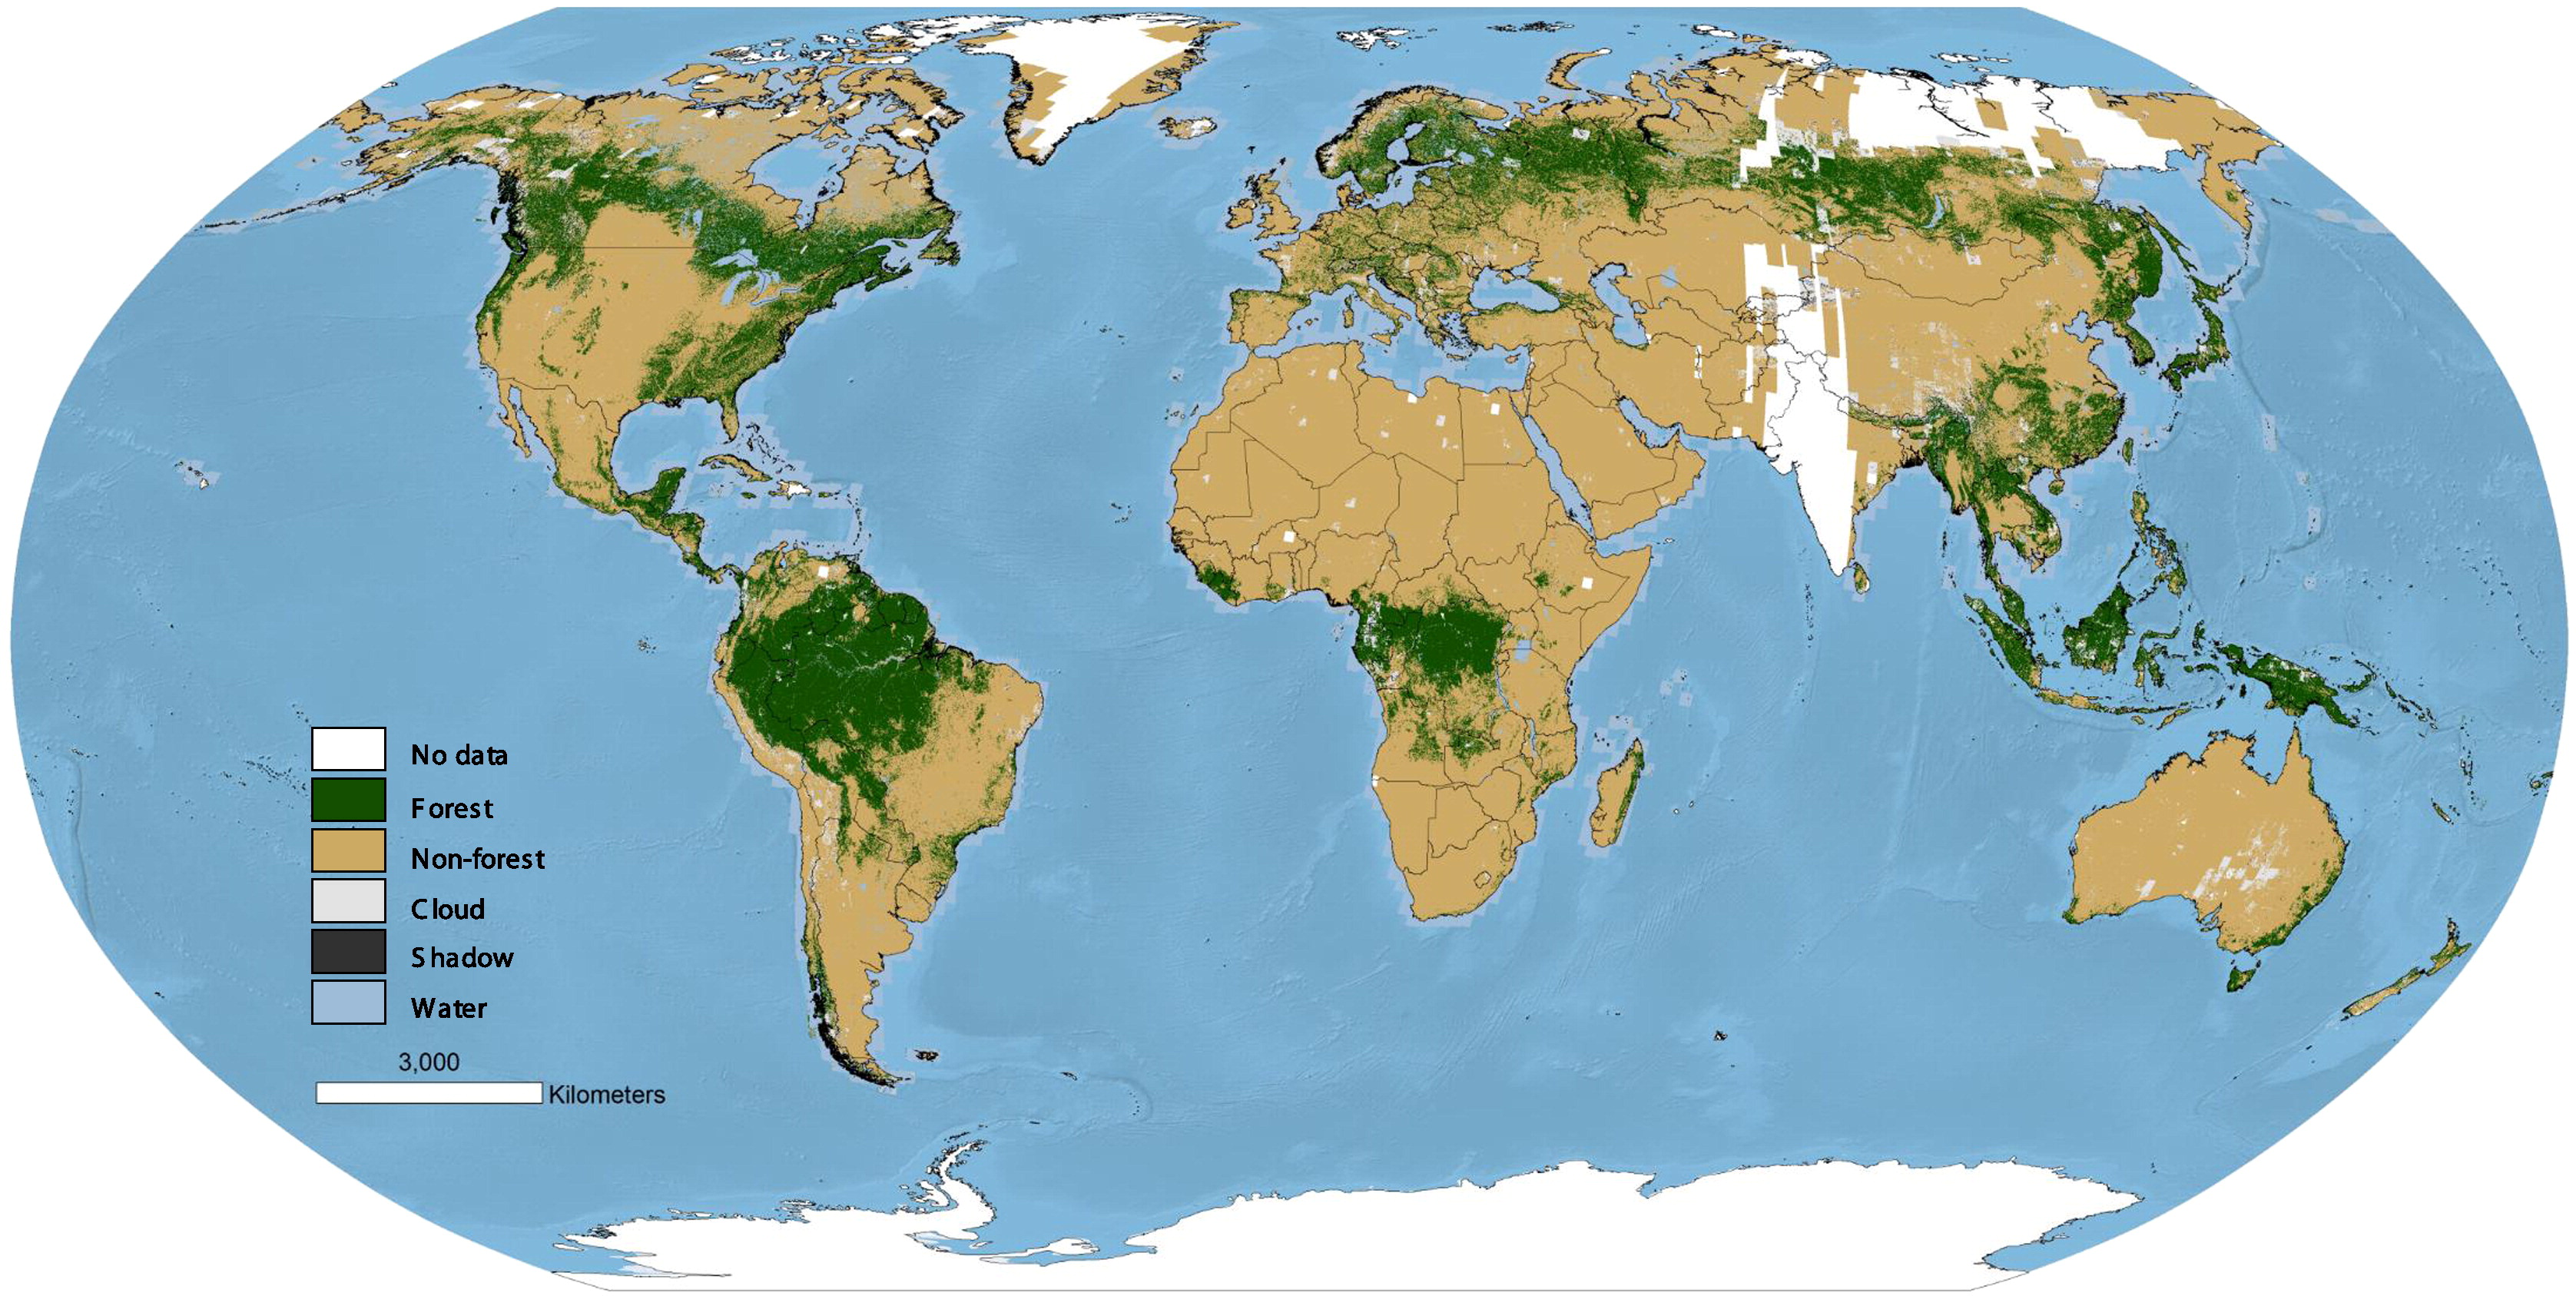
Global distribution of forest cover, circa-1990. Click image to enlarge
Researchers have created a global map of the world’s forests in the year 1990, enabling accurate comparisons between past and current deforestation rates. The GIS data underpinning the map is available at LandCover.org.
The research, published by University of Maryland scientists in the journal Remote Sensing of Environment, is based on 30-meter resolution NASA satellite data, providing the highest-resolution map of 1990 forest cover ever developed. The data is consistent with a recent study that developed maps for year 2000 and year 2005 forest cover, allowing researchers to measure 1990s forest cover change.
The researchers are now working on maps that will depict forest cover in 1975 and 2010. These should be ready in 2015. Individual country data for 1990 will be available soon, according to the authors.
“We are working on the publication of the statistics derived from the data set,” lead author Do-Hyung Kim told mongabay.com. “The data will be made freely available this December from the GLCF website (www.landcover.org).”
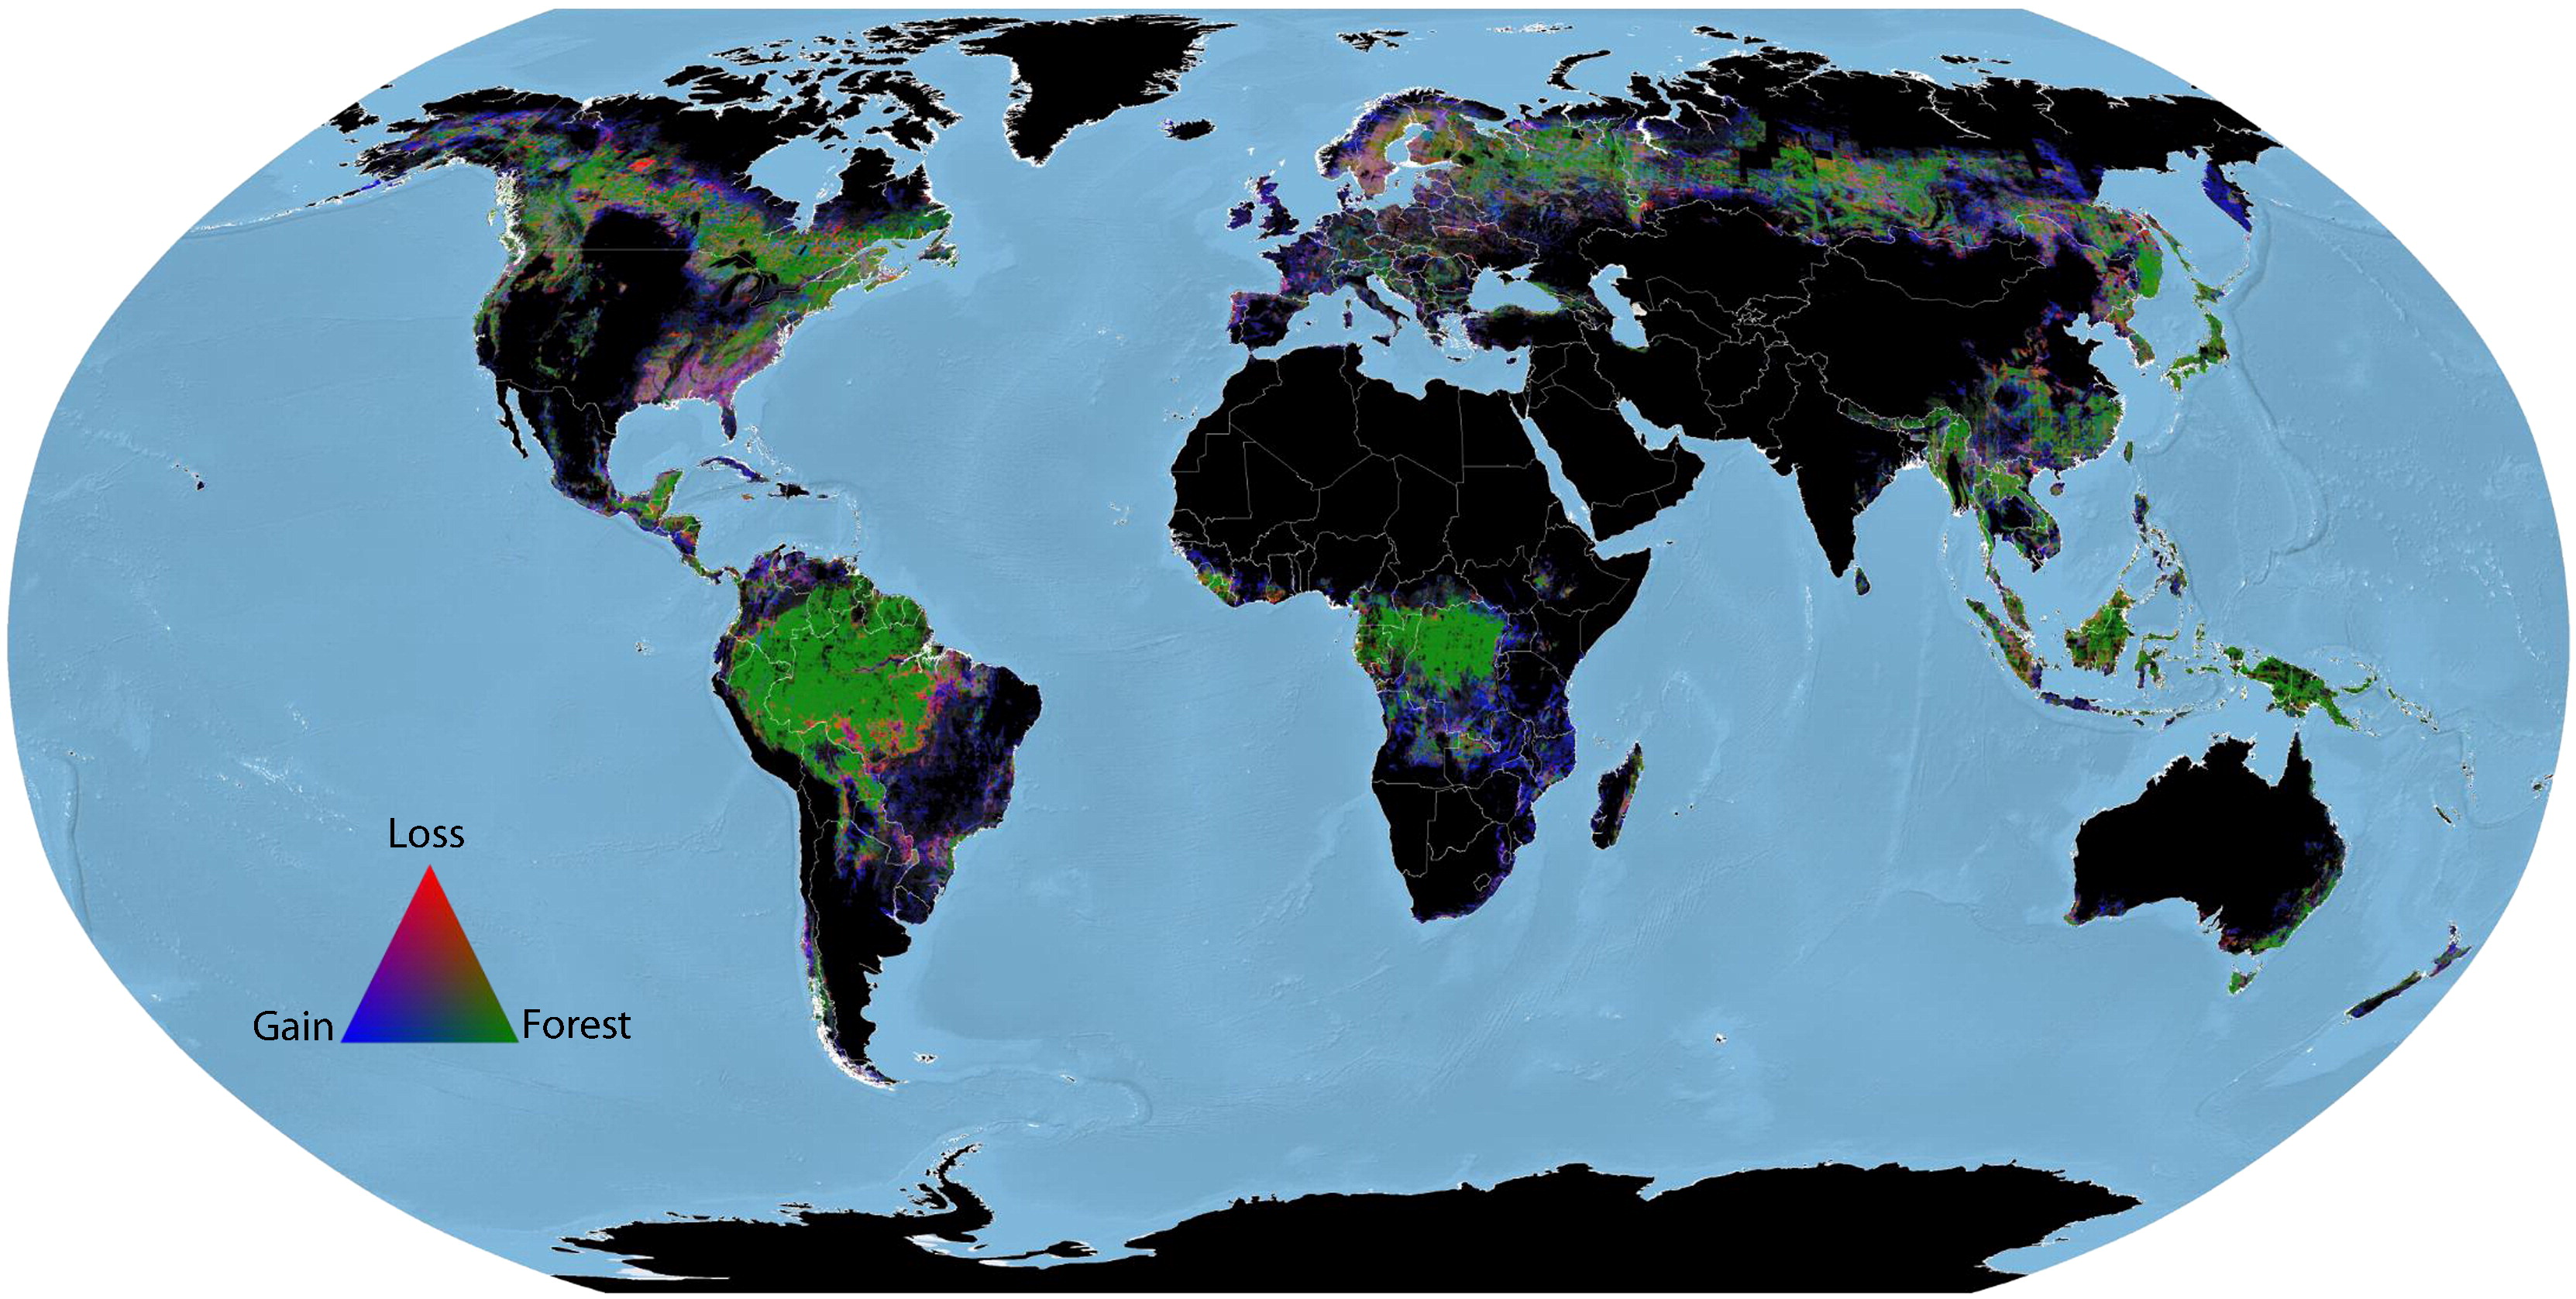
Global distribution of forest-cover change, circa-1990 to -2000. The false-color composite was aggregated from 30-m to 5-km grid cells. Forest loss is represented in red, forest gain in blue and persistent forest in green. Colors are stretch in the proportion of 1 (forest): 4 (gain): 4 (loss). Image and caption courtesy of the authors. Click image to enlarge
The new 1990 map represents a major improvement over the current standard, which was developed by the United Nations Food and Agriculture Organization (FAO) based on self-reporting by countries.
“Before this, the only source of information on pre-2000 forest-cover changes was the FAO [United Nations Food and Agriculture Organization] report, which has been criticized for its inconsistent definition of ‘forest’ and its reliance on self-reporting by the countries doing the deforestation,” said Do-Hyung Kim in a statement.
The findings are broadly consistent with FAO, although there are a few notable exceptions.
“In inland Southeast Asia, including Thailand, Vietnam and Cambodia, our results show much lower deforestation rates than post-2000 period, in contrast to FAO estimates (FAO, 2010) showing rather monotonic forest cover change trends between the two periods,” the authors write.

Regional forest-cover change in: (A) the Southeastern United States, (B) Amazon Basin, (C) Northern Canada, (D) Southern Sweden, and (E) Indonesia. Click image to enlarge
The new study confirms that deforestation was particularly high in boreal regions and the tropics in the 1990s.
“We identified that the net forest loss in Brazil increased by 40 percent (from 1.9 million ha/year to 2.7 million ha/yr) between the 1990s and 2000s (2000-2005 period),” Do-Hyung Kim told Mongabay.
CITATION: Kim, D.-H., J.O. Sexton, P. Noojipady, C. Huang, A. Anand, S. Channan, M. Feng. J.R. Townshend. (2014) Global, Landsat-based forest-cover change from 1990 to 2000. Remote Sensing of Environment DOI: 10.1016/j.rse.2014.08.017.