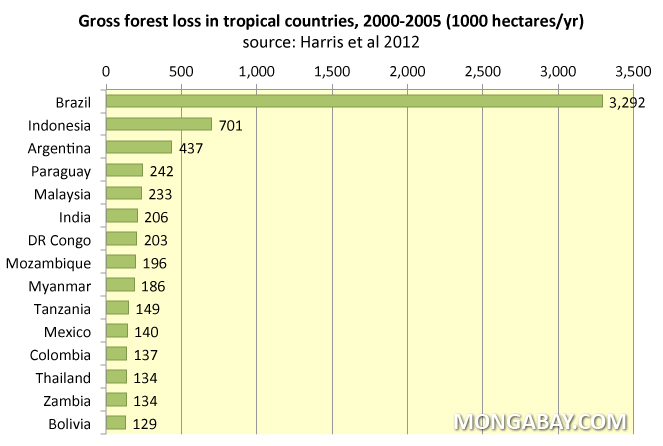
Gross forest loss in tropical countries, 2000-2005 according to Harris et al (2012).
A study published last month in the journal Science came up with new estimates of tropical forest loss between 2000 and 2005. The research — led by Nancy Harris of Winrock International and also involving scientists from Applied GeoSolutions, NASA’s Jet Propulsion Laboratory and the University of Maryland — was based on analysis of remote sensing data calibrated with field studies.
Like other assessments, the study found Brazil and Indonesia lost the greatest extent of forest during the period. But some of their data differed substantially from the default source of forest data, the U.N. Food and Agriculture Organization. For example, according to Harris and colleagues, Indonesia’s gross forest loss was twice as high as estimated by FAO, while India’s was one million hectares higher. But Myanmar and Tanzania had substantially lower loss under the methodology used in the Science paper.
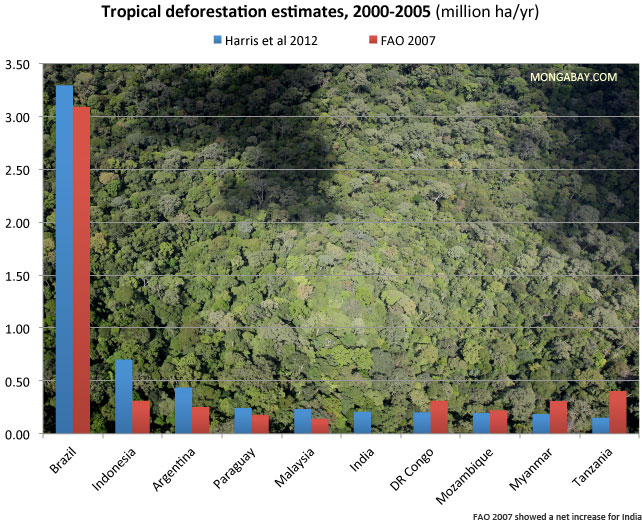
Countries with the highest gross forest loss between 2000 and 2005 according to the new study and earlier work by the FAO. Click image to enlarge.
The objective of the study was to quantify emissions from deforestation. Harris and colleagues estimated gross carbon emissions from deforestation at 810 million metric tons (with a 90 percent confidence interval of 0.57-1.22 billion tons) per year from 2000-2005, significantly below earlier calculations. Brazil and Indonesia accounted for 55 percent of gross emissions from tropical deforestation during the study period, while dry forests accounted for 40 percent of tropical forest loss but amounted to only 17 percent of emissions.
The study did not look at carbon emissions from logging or other forms of forest degradation, including peatlands drainage and burning. The authors noted another study found emissions from these sources amounted to 272 million tons per year in the study period, adding roughly a third more to their results. The research also did not account for forest recovery in the tropics, nor land use change in temperate regions.
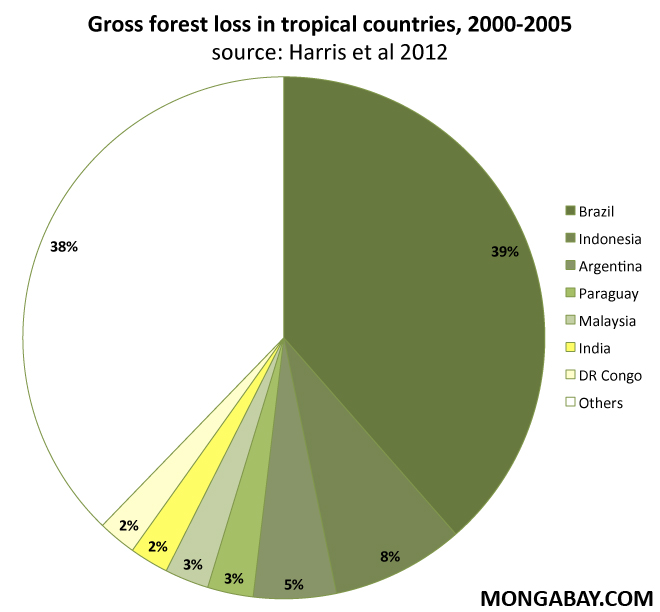
Gross forest loss in tropical countries, 2000-2005 according to Harris et al (2012).
The researchers say the next phase of their analysis will look at the 2006-2010 period.
For more on the study, including other charts and maps, see Deforestation accounts for 10 percent of global carbon emissions, argues new study .
Data table
Note: this table only includes mean and median estimates from the study. For the full results, download the supplemental online materials [PDF].
| Forest Area 2000 | Gross Forest Cover Loss | Forest Carbon Stock Density | Emissions from Deforestation | |||||
| (Median estimate) | (Mean estimate) | (Median estimate) | ||||||
| Country | (Million ha) | ha/yr | tons/ha | M tC/yr | ||||
| Brazil | 458 | 3,292,000 | 116 | 340 | ||||
| Indonesia | 107 | 701,000 | 155 | 105 | ||||
| Argentina | 49 | 437,000 | 24 | 10 | ||||
| Paraguay | 21 | 242,000 | 27 | 9 | ||||
| Malaysia | 22 | 233,000 | 179 | 41 | ||||
| India | 42 | 206,000 | 104 | 18 | ||||
| DR Congo | 167 | 203,000 | 128 | 23 | ||||
| Mozambique | 34 | 196,000 | 42 | 9 | ||||
| Myanmar | 33 | 186,000 | 155 | 29 | ||||
| Tanzania | 23 | 149,000 | 45 | 7 | ||||
| Mexico | 46 | 140,000 | 48 | 8 | ||||
| Colombia | 63 | 137,000 | 138 | 14 | ||||
| Thailand | 17 | 134,000 | 126 | 16 | ||||
| Zambia | 29 | 134,000 | 43 | 7 | ||||
| Bolivia | 61 | 129,000 | 90 | 11 | ||||
| Angola | 49 | 126,000 | 47 | 6 | ||||
| Zimbabwe | 9 | 119,000 | 30 | 5 | ||||
| Venezuela | 49 | 115,000 | 134 | 9 | ||||
| South Africa | 13 | 99,000 | 28 | 4 | ||||
| Sudan | 17 | 95,000 | 45 | 4 | ||||
| Laos | 16 | 85,000 | 164 | 15 | ||||
| Nigeria | 12 | 81,000 | 83 | 4 | ||||
| Ethiopia | 16 | 68,000 | 53 | 4 | ||||
| Chile | 17 | 67,000 | 52 | 6 | ||||
| CAR | 36 | 65,000 | 66 | 4 | ||||
| Cambodia | 9 | 58,000 | 127 | 8 | ||||
| Peru | 68 | 57,000 | 158 | 7 | ||||
| Vietnam | 14 | 55,000 | 127 | 8 | ||||
| Cameroon | 26 | 54,000 | 142 | 7 | ||||
| Madagascar | 16 | 52,000 | 70 | 3 | ||||
| Guatemala | 6 | 50,000 | 92 | 5 | ||||
| Nicaragua | 5 | 50,000 | 113 | 6 | ||||
| PNG | 31 | 50,000 | 152 | 7 | ||||
| Botswana | 4 | 48,000 | 19 | 1 | ||||
| Philippines | 10 | 40,000 | 118 | 6 | ||||
| Cote d’Ivoire | 8 | 39,000 | 85 | 3 | ||||
| Kenya | 4 | 39,000 | 54 | 2 | ||||
| Ecuador | 13 | 37,000 | 149 | 4 | ||||
| Chad | 5 | 37,000 | 31 | 1 | ||||
| Ghana | 5 | 30,000 | 94 | 2 | ||||
| Caribbean | 7 | 28,000 | 46 | 2 | ||||
| Mali | 3 | 28,000 | 44 | 1 | ||||
| Guinea | 9 | 27,000 | 57 | 2 | ||||
| Rep. of Congo | 23 | 26,000 | 160 | 3 | ||||
| Gabon | 19 | 24,000 | 164 | 4 | ||||
| Uganda | 5 | 23,000 | 65 | 1 | ||||
| Somalia | 1 | 20,000 | 34 | 1 | ||||
| Uruguay | 3 | 19,000 | 28 | 1 | ||||
| Honduras | 6 | 17,000 | 77 | 1 | ||||
| Namibia | 1 | 17,000 | 16 | – | ||||
| Nepal | 5 | 16,000 | 103 | 2 | ||||
| Sierra Leone | 3 | 16,000 | 83 | 1 | ||||
| Liberia | 7 | 14,000 | 147 | 2 | ||||
| Senegal | 2 | 14,000 | 26 | – | ||||
| Guyana | 16 | 13,000 | 161 | 1 | ||||
| Costa Rica | 3 | 12,000 | 105 | 1 | ||||
| Panama | 3 | 12,000 | 115 | 1 | ||||
| Benin | 2 | 12,000 | 29 | – | ||||
| Malawi | 2 | 10,000 | 40 | – | ||||
| Belize | 1 | 9,000 | 105 | 1 | ||||
| Bangladesh | 2 | 7,000 | 94 | 1 | ||||
| Sri Lanka | 3 | 7,000 | 94 | 1 | ||||
| Suriname | 12 | 6,000 | 161 | 1 | ||||
| Togo | 1 | 6,000 | 49 | – | ||||
| Bhutan | 2 | 4,000 | 152 | 1 | ||||
| Burundi | 1 | 3,000 | 64 | – | ||||
| Equatorial Guinea | 2 | 3,000 | 160 | 1 | ||||
| Lesotho | 1 | 3,000 | 19 | – | ||||
| El Salvador | 1 | 2,000 | 49 | – | ||||
| French Guiana | 7 | 2,000 | 160 | – | ||||
| Guinea-Bissau | 1 | 2,000 | 37 | – | ||||
| Swaziland | 1 | 2,000 | 32 | – |
CITATION:
Nancy L. Harris,
Sandra Brown,
Stephen C. Hagen,
Sassan S. Saatchi,
Silvia Petrova,
William Salas,
Matthew C. Hansen,
Peter V. Potapov,
and Alexander Lotsch. Baseline Map of Carbon Emissions from Deforestation in Tropical Regions. Science 22 June 2012: Vol. 336 no. 6088 pp. 1573-1576 DOI: 10.1126/science.1217962