|
|
Given that deforestation accounts for nearly one fifth of anthropogenic greenhouse gas emissions, reducing forest clearing and degradation is increasingly seen as an critical component to any framework addressing climate change. By some estimates, a mechanism that compensates countries for reducing emissions from deforestation and forest degradation (REDD) could funnel billions of dollars per year towards forest conservation. However the effectiveness of such a mechanism will hinge on the quality of data. Effective mapping and monitoring of forest carbon stores is absolutely key to any mechanism that compensates countries for reducing emissions from deforestation and forest degradation.
In the past carbon stores, or biomass, of tropical forests has been estimated by field assessments, a slow and labor intensive effort that can be prone to error over large areas due to sparse sampling, differences in vegetation cover, gradients, and other factors. This is rapidly changing. A range of new remote sensing technologies, coupled with enhanced analysis of past data, including field measurements, are allowing scientists to more accurately map forest structure carbon and could play a crucial role in REDD monitoring.
A new paper, published in Carbon Balance and Management by a team of scientists from the Woods Hole Research Center, reviews some of these technologies and concludes that a combination of remote sensing methods will be the most effective approach to global carbon stock mapping.
“No single sensor on any satellite mission, whether radar, lidar or optical, can be expected to provide consistently infallible estimates of biomass, but use of these measurements in a synergistic fashion can potentially overcome the limitations of each,” wrote the authors, who note that different technologies are more more appropriate for certain environments. For example, LiDAR (a type of active sensor that send out pulses of energy and reads the radiation that bounces back) can be used to map vegetation structure in dense tropical forests.
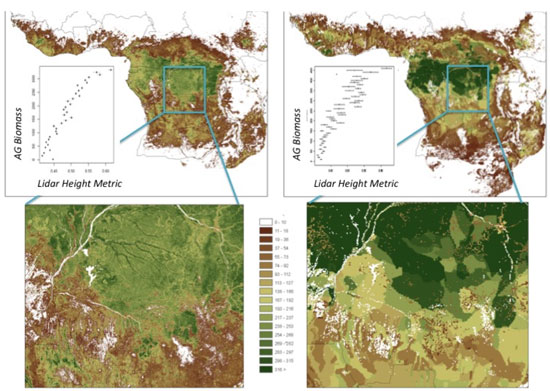 Map of above-ground biomass (AGB) across Africa produced using a “Direct Remote Sensing” approach (left) and a “Combine and Assign” approach (right). The top images show maps of AGB for the tropical forest regions of Africa, with boxes indicating those areas shown in the bottom images. The Direct Remote Sensing approach shows more detail across the region, characterized by transitions between vegetation types ranging from dense humid forest in the Congo Basin to more open woodlands to the south. Note the more continuous nature of the map on the left, and the more aggregated spatial units in the map on the right. The inset line graphs in the top images show how the range of AGB relates to independent Lidar metrics that are closely related to field estimates of AGB. Note the Lidar values in the left graphic have a narrower range of variability within each AGB value than the right graphic, indicating less uncertainty at any given location in the [Direct Remote Sensing] map. Caption text and image courtesy of Goetz et al (2009). See Baccini at al (2009) for more details. |
Scott Goetz, lead author of the paper, says that basing REDD policies on a carbon stock mapping approach using satellite remote sensing, coupled with field measurements, would vastly improve estimates of carbon storage in tropical forests while also better informing the compensation mechanisms.
“A wide range of satellite sensors are available to inform tropical forest monitoring efforts, including carbon stock mapping,” he told mongabay.com. “It is important that UNFCCC policies are formulated to allow sufficient flexibility to incorporate these new satellite-based maps. This is particularly true given that new satellite missions specifically designed for biomass mapping will become operational in the next few years.”
The paper is available at Mapping and monitoring carbon stocks with satellite observations: a comparison of methods.
An overview of the new satellite missions was recently published by Richard Houghton, also of the Woods Hole Research Center, and Goetz. That paper is available at New Satellites Help Quantify Carbon Sources and Sinks.
References:
Baccini, A., Laporte, N., Goetz, S. J., Sun, M., Dong, H., 2008. A first map of Tropical Africa’s above-ground biomass derived from satellite imagery. Environmental Research Letters. Online journal.
Related articles
Complete map of world forests to help REDD carbon trading initiative (02/28/2008
Policymakers, conservationists and scientists have high hopes that REDD, a mechanism for compensating countries for reducing emissions from deforestation and forest degradation, will spur a massive flow of funds to tropical countries, helping preserve rainforests and delivering economic benefits to impoverished rural communities.
Satellites and Google Earth prove potent conservation tool
(03/26/2009)
Armed with detailed images from space and remote sensing data, scientists, environmentalists, and armchair conservationists are now tracking threats to the planet and communicating them vividly to the public.