First carbon map of America released by NASA
NASA releases a new map of America showing local carbon emissions; Texas leads
Jeremy Hance, mongabay.com
July 15, 2008
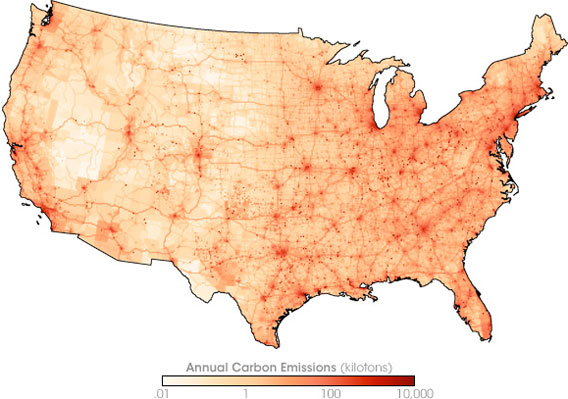
The Vulcan Project maps American carbon dioxide emissions. The map shows annual emissions in 2002 (kilotons of carbon) from urban centers (larger red patches), widely scattered point sources like remote power stations or smelters (small red dots), and highways. (Map by Jesse Allen, based on data from the Vulcan Project.)
|
|
For the first time, one can have a whole view of America’s carbon output: region by region, city by city. The Vulcan Project has undertaken a holistic inventory—including electricity, heat, transportation, and industry—of local carbon emissions across the nation to create the first carbon map of America. Texas leads the fifty states, and the county of Harris, Texas (encompassing Houston) records the nation’s largest emissions by county. Although Texas is second in population after California, its massive industry puts it over the top.
The Vulcan Project, named after the Roman god of fire, found that different areas have different reasons for being at the top of the list.
“Consider the top three counties,” says Kevin Gurney, referring to Harris, Texas, Los Angeles, California, and Cook County, Illinois. “Around Houston, it’s industrial emissions that pushes them to the top of the list. In Los Angeles, it’s cars. In Chicago, it’s residential and commercial heating—because the temperatures are cold and the houses and buildings are old.”
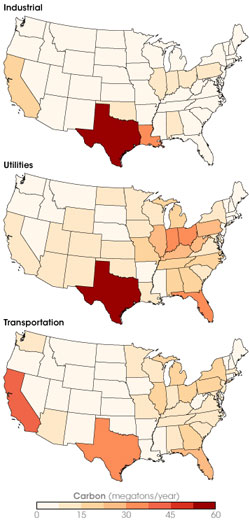 The Vulcan inventory summarizes emissions from different processes. With a concentration of oil refineries along the Gulf Coast, Texas leads the nation in industrial emissions of carbon dioxide. Texas’ 5.7 gigatons of carbon per year is 50 percent more than neighboring Louisiana’s emissions, and 150 percent more than third-place California’s. Texas’ emissions from utilities are higher than California’s, even though California has a larger population. This reversal is partly because California imports electricity from surrounding states. Coal-fired power plants in the Ohio Valley export electricity to the Northeast, making utility emissions in less populated states, including West Virginia and Kentucky, higher than more populated states, like New Jersey and New York. California, famous for its car culture, has the highest carbon dioxide emissions for the transportation sector. Wide-open Texas also has relatively high emissions. Nationally, transportation emissions are higher in the East than the West. (Maps by Jesse Allen, based on data from the Vulcan Project.) |
But Gurney, who is a researcher on the Vulcan Project, does not believe the study should be used to scold regions with high emissions.
“It’s really a story about American life, about how people live in different parts of the country, what their energy needs are and how they meet them.”
Not only does the Vulcan Project measure carbon by geography, it also does so by time. In a normal American week, not surprisingly, emissions are highest during weekdays. Weekends consistently have the lowest emissions with Sunday the nadir of the week. Most days are above 4 million tons of carbon, while Sunday often dips below 3.5. In addition, summers are the highest season in America for emissions. The researchers are not yet certain why this is: it may be a combination of increased travel and air-conditioning across the nation.
Before Project Vulcan emissions were not accurately measured locally. “We had annual estimates at the national level,” Gurney explained, “which you can get from basic UN [United Nations] statistics derived from sales of coal, oil, and natural gas around the world.” These national statistics would then be disturbed around the country based solely on population density.
A change in the mindset of policy makers has helped Project Vulcan became a reality.
“A decade ago,” says Gurney, “the policy community was thinking in very broad terms.” Now, however, states are considering new climate laws, governors are giving speeches on climate change, mayors and city councils are looking at reducing their city’s carbon footprint, and citizens have become increasingly active and concerned.
Such widespread interest, both at the local and regional level, has brought about the next stage in Project Vulcan’s future: Project Hestia, named after the Greek goddess of home and hearth, proposes to create a global inventory of carbon emissions that will have information at the micro-level of neighborhoods. The information will be available online with a maneuverable, three-dimensional world. Think Google Earth, only with smokestacks.
Project Vulcan was sponsored by NASA and the Department of Energy. The project believes that leaders—local and national—need the best possible data to make effective reductions in carbon emissions.