Obesity rates increase nationwide in 2006
Obesity rates increase nationwide in 2006
mongabay.com
August 27, 2007
31 states saw a rise in obesity rates last year, reports a new study by the Trust for America’s Health, a research group that focuses on disease prevention.
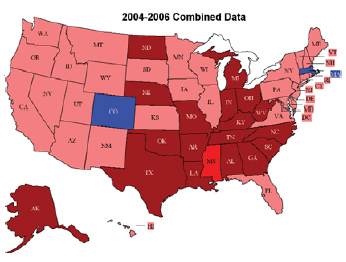
OBESITY TRENDS* AMONG U.S. ADULTS |
Mississippi became the first state to have more than 30 percent of the adult population classified as obese, while two-thirds of American adults are either overweight or obese.
Colorado was the leanest state this year, though its adult obesity rate increased over the past year (from 16.9 to 17.6 percent).
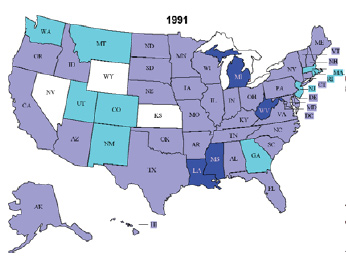
Rates of adult obesity now exceed 25 percent in 19 states, an increase from 14 states last year and 9 in 2005. In 1991, none of the states exceeded 20 percent.
The report also finds that rates of overweight children (ages 10 to 17) ranged from a high of 22.8 percent in Washington, D.C. to a low of 8.5 percent in Utah. Eight of the ten states with the highest rates of overweight children were in the South.
No states saw a decrease in obesity rates.
Obesity is a major factor in the onset of Type II diabetes, rates of which have been increasing rapidly in the United States.
Report: F as in Fat: How Obesity Policies are Failing in America, 2007
National obesity rankings
| State | Adult % obese 2004-2006 |
rank | Adult % overweight 2004-2006 |
rank | Adult % diabetes 2004-2006 |
rank | Age 10-17 % overweight 2003-2004 |
rank |
| Alabama | 29.4% | 3 | 64.7% | 4 | 9.3% | 5 | 16.7% | 11 |
| Alaska | 25.8% | 16 | 63.7% | 9 | 4.8% | 50 | 11.1% | 44 |
| Arizona | 21.7% | 43 | 57.3% | 45 | 7.6% | 21 | 12.2% | 38 |
| Arkansas | 27.0% | 8 | 63.7% | 8 | 7.8% | 18 | 16.4% | 12 |
| California | 22.7% | 36 | 59.9% | 34 | 7.4% | 26 | 13.2% | 32 |
| Colorado | 17.6% | 51 | 54.2% | 51 | 4.8% | 51 | 9.9% | 49 |
| Connecticut | 20.1% | 47 | 57.7% | 44 | 6.3% | 42 | 12.3% | 37 |
| D.C. | 22.2% | 40 | 55.0% | 49 | 7.8% | 16 | 22.8% | 1 |
| Delaware | 23.6% | 29 | 62.2% | 20 | 7.9% | 15 | 14.8% | 19 |
| Florida | 22.9% | 34 | 60.0% | 33 | 8.4% | 10 | 14.4% | 21 |
| Georgia | 26.1% | 14 | 61.4% | 24 | 8.3% | 11 | 16.4% | 13 |
| Hawaii | 20.1% | 47 | 54.5% | 50 | 7.8% | 20 | 13.3% | 31 |
| Idaho | 23.2% | 31 | 59.8% | 36 | 6.6% | 39 | 10.1% | 48 |
| Illinois | 24.4% | 25 | 60.7% | 29 | 7.4% | 23 | 15.8% | 14 |
| Indiana | 26.8% | 9 | 62.5% | 18 | 8.0% | 14 | 15.6% | 16 |
| Iowa | 24.9% | 20 | 62.1% | 21 | 6.8% | 36 | 12.5% | 35 |
| Kansas | 24.3% | 27 | 61.3% | 26 | 6.9% | 34 | 14.0% | 24 |
| Kentucky | 27.5% | 7 | 64.9% | 3 | 8.8% | 8 | 20.6% | 3 |
| Louisiana | 28.2% | 4 | 63.4% | 10 | 8.9% | 7 | 17.2% | 9 |
| Maine | 23.0% | 33 | 60.1% | 32 | 7.3% | 28 | 12.7% | 34 |
| Maryland | 24.4% | 25 | 60.1% | 31 | 7.4% | 25 | 13.3% | 30 |
| Massachusetts | 19.8% | 50 | 55.3% | 48 | 6.1% | 45 | 13.6% | 27 |
| Michigan | 26.8% | 9 | 62.7% | 16 | 8.3% | 12 | 14.5% | 20 |
| Minnesota | 23.7% | 28 | 61.3% | 25 | 5.5% | 48 | 10.1% | 47 |
| Mississippi | 30.6% | 1 | 66.5% | 1 | 10.1% | 2 | 17.8% | 8 |
| Missouri | 26.3% | 12 | 62.8% | 15 | 7.5% | 22 | 15.6% | 15 |
| Montana | 20.7% | 45 | 58.0% | 43 | 6.0% | 46 | 11.1% | 45 |
| Nebraska | 25.4% | 18 | 63.0% | 12 | 7.0% | 32 | 11.9% | 41 |
| Nevada | 22.5% | 37 | 60.8% | 28 | 7.0% | 31 | 12.4% | 36 |
| New Hampshire | 22.4% | 38 | 59.5% | 39 | 6.8% | 35 | 12.9% | 33 |
| New Jersey | 22.2% | 40 | 59.6% | 37 | 7.3% | 27 | 13.7% | 26 |
| New Mexico | 22.0% | 42 | 59.3% | 40 | 7.1% | 29 | 16.8% | 10 |
| New York | 22.4% | 38 | 58.6% | 42 | 7.8% | 19 | 15.3% | 18 |
| North Carolina | 25.6% | 17 | 62.3% | 19 | 8.7% | 9 | 19.3% | 5 |
| North Dakota | 25.1% | 19 | 63.8% | 6 | 6.4% | 41 | 12.1% | 39 |
| Ohio | 26.0% | 15 | 62.5% | 17 | 7.4% | 24 | 14.2% | 22 |
| Oklahoma | 26.8% | 9 | 62.9% | 14 | 9.0% | 6 | 15.4% | 17 |
| Oregon | 23.3% | 30 | 59.8% | 35 | 6.7% | 37 | 14.1% | 23 |
| Pennsylvania | 24.5% | 23 | 61.4% | 23 | 8.2% | 13 | 13.3% | 29 |
| Rhode Island | 20.5% | 46 | 58.8% | 41 | 7.0% | 33 | 11.9% | 42 |
| South Carolina | 27.8% | 5 | 63.7% | 7 | 9.4% | 4 | 18.9% | 7 |
| South Dakota | 24.9% | 20 | 62.9% | 13 | 6.5% | 40 | 12.1% | 40 |
| Tennessee | 27.8% | 5 | 63.9% | 5 | 9.4% | 3 | 20.0% | 4 |
| Texas | 26.3% | 12 | 63.1% | 11 | 7.8% | 17 | 19.1% | 6 |
| Utah | 21.1% | 44 | 55.8% | 46 | 5.4% | 49 | 8.5% | 51 |
| Vermont | 20.0% | 49 | 55.4% | 47 | 5.8% | 47 | 11.3% | 43 |
| Virginia | 24.5% | 23 | 61.0% | 27 | 7.1% | 30 | 13.8% | 25 |
| Washington | 23.2% | 31 | 59.5% | 38 | 6.6% | 38 | 10.8% | 46 |
| West Virginia | 29.8% | 2 | 65.5% | 2 | 11.1% | 1 | 20.9% | 2 |
| Wisconsin | 24.8% | 22 | 61.8% | 22 | 6.2% | 44 | 13.5% | 28 |
| Wyoming | 22.8% | 35 | 60.2% | 30 | 6.3% | 43 | 8.7% | 50 |