CO2 emission reductions lag 25% behind 2012 targets
CO2 emission reductions lag 25% behind 2012 targets
India’s CO2 emissions leap 88% since 1990, China’s 73%
mongabay.com
May 8, 2007
The world is far behind carbon dioxide emissions targets set by the Kyoto Protocol reports the Little Green Data Book 2007, an annual publication put out by the World Bank. The publication notes that global carbon dioxide emissions have risen 19 percent since 1990, more than 25 percent behind goals set forth under the Kyoto Protocol, which called for a 5.2 percent reduction from 1990 levels.
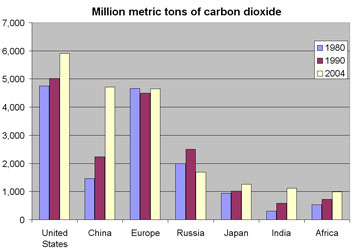
The rise has been driven by surging emissions from China (73 percent increase) and India (88 percent increase) as well as the United States (20 percent increase) and Japan (15 percent increase). Europe’s emissions, including only European Monetary Union countries, have climbed by only 3 percent over the period.
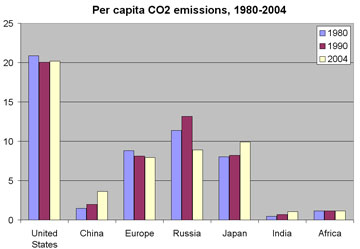
Despite rapid growth in India and China, per capita emissions still lag far behind those of Europe and the United States. The average Chinese citizen emits less than one-sixth that of the average American. For Indians, the per capita amount is only six percent of the average American.
The Little Green Data Book 2007 reports that fossil fuels continue to be the dominant source of energy, responsible generating 66 percent of electricity worldwide.
  |
“Energy policy will play a crucial role in determining future emissions,” said Warren Evans, Director of Environment, World Bank. “Technologies are already available to minimize emissions in the energy sector. They include the use of ultra-efficient coal-fired plants, the use of natural gas and advanced renewable energies.”
While most emissions in developed countries result from fossil fuel combustion, deforestation and land use change is the largest contributor to greenhouse gas emissions of developing countries. For example, Indonesia, which ranks only as only the world’s 22nd largest economy, has the third highest level of emissions after the United States and China due to deforestation and destruction of its carbon-rich peatlands.
“On average, land use change, forestry, and agriculture account for more than half of the emissions of greenhouse gases in developing countries, compared to 10 percent in industrialized countries,” added Evans. “In order for a post-Kyoto climate change agreement to work, developed and developing nations should take into account the benefits of avoided deforestation and create the necessary financial mechanisms to transfer resources to countries that effectively protect their forests.”
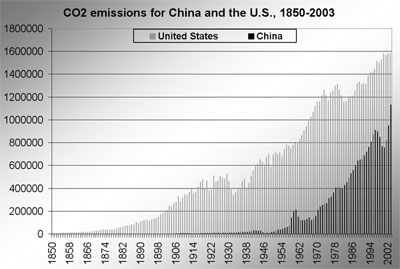
The race for the title of “Largest carbon dioxide emitter” pits the United States versus China. The United States had a large head start but China is expected to surpass it in emissions this year or next. More charts below. |
Deforestation occurs almost exclusively in poor countries; data from the U.N. shows that forest cover is actually increasing in wealthier countries. The Little Green Data Book 2007 reports that between 1990 and 2005, nearly 45,000 square kilometers of forest were lost in low income countries ( an annual deforestation rate of 0.5 percent) and 38,000 square kilometers in lower middle income countries (annual deforestation: 0.16 percent).
“Deforestation is not only a cause of increased carbon dioxide emissions,” said Kirk Hamilton, Lead Environmental Economist, World Bank, and lead author of the report, “but it is in itself a consequence of poverty. Tropical rain forests are diminishing at an alarming rate because of the human need for food and demands for timber, energy, minerals, and other resources. Forests host at least half of all life forms on earth, and as deforestation continues, the biodiversity of the planet is being seriously affected.”
“There is growing recognition that wise forest management is critical to sustainable development, particularly where the local or national economy is based directly on the use of forest resources,” he added. “In addition, forest ecosystems have major impacts on soil, water, and coastal marine productivity over very large areas. They also have a significant influence on the global carbon cycle, which plays a crucial role in local and global climate regulation.”
The report notes that in poor countries some deforestation is driven by the use of biomass as fuel. It cites Africa, where 56 percent of total energy use comes from traditional biomass, as a leading example. Ironically demand for energy crops from rich countries may now be worsening the situation, with hundreds of thousands of hectares of forest in the Amazon and southeast Asia being converting annually for biofuels production. While the report doesn’t detail this development, it does not that use of traditional biomass as fuel causes respiratory problems from indoor smoke.
CHARTS
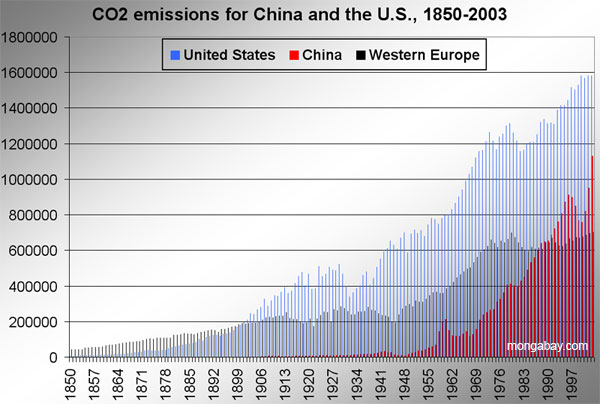
Graph showing the growth of carbon dioxide emissions in China, the United States, and Western Europe from 1850-2003. Image created by Rhett A. Butler of mongabay.com using data from the Carbon Dioxide Information Analysis Center. [click image to enlarge]
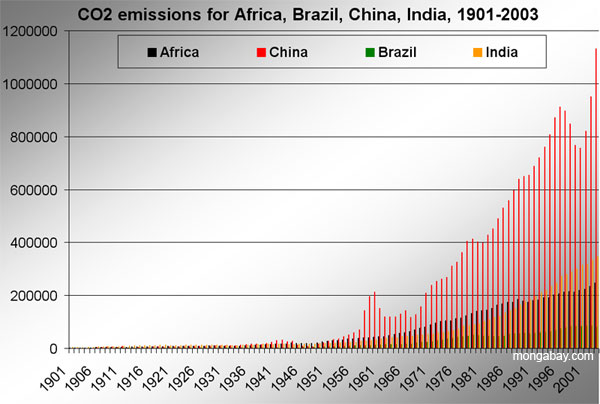
Graph showing the growth of carbon dioxide emissions in Africa, Brazil, China, and India from 1901-2003. Image created by Rhett A. Butler of mongabay.com using data from the Carbon Dioxide Information Analysis Center. [click image to enlarge]
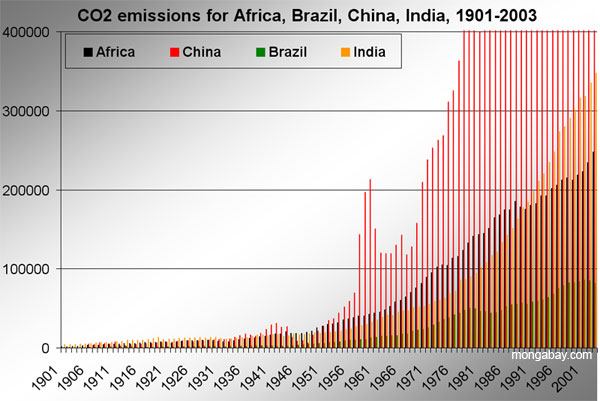
Graph showing the growth of carbon dioxide emissions in Africa, Brazil, China, and India from 1901-2003. Image created by Rhett A. Butler of mongabay.com using data from the Carbon Dioxide Information Analysis Center. [click image to enlarge]
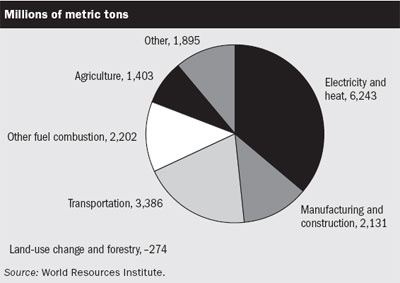
Chart showing carbon dioxide emissions by source, 2000. Image courtesy of Little Green Data Book 2007
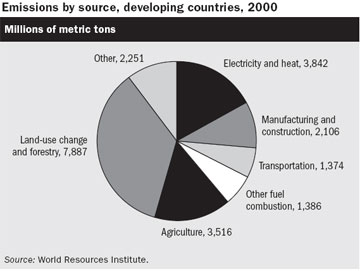
Chart showing carbon dioxide emissions by source for developing countries, 2000. Image courtesy of Little Green Data Book 2007
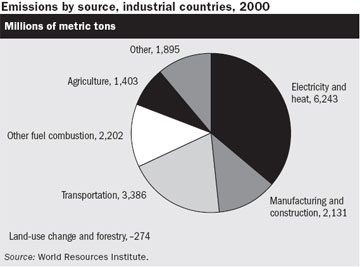
Chart showing carbon dioxide emissions by source for industrial countries, 2000. Image courtesy of Little Green Data Book 2007

Chart showing share of carbon dioxide emissions, 2007. Image courtesy of Little Green Data Book 2007
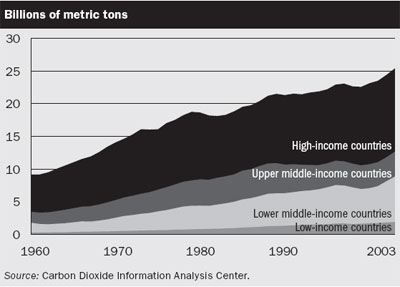
Chart showing carbon dioxide emissions growth 1960-2003, 2007. Image courtesy of Little Green Data Book 2007
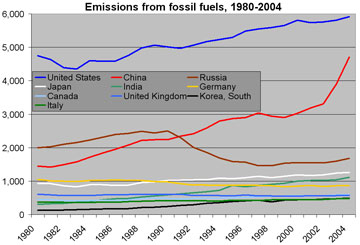
Chart showing carbon dioxide emissions from various countries, 1980-2005
CITATION: Marland, G., T.A. Boden, and R. J. Andres. 2006. Global, Regional, and National Fossil Fuel CO2 Emissions. In Trends: A Compendium of Data on Global Change. Carbon Dioxide Information Analysis Center, Oak Ridge National Laboratory, U.S. Department of Energy, Oak Ridge, Tenn., U.S.A.