Avoided deforestation help fight third world under global warming pact
Avoided deforestation could help fight third world poverty under global warming pact
$43 billion could flow into developing countries
Rhett Butler, mongabay.com
October 31, 2006
An avoided deforestation strategy for mitigating climate change could mean billions for world’s poorest countries while preserving biodiversity and ecosystem services
Avoided deforestation will be a hot point of discussion at next week’s climate meeting in Nairobi, Kenya. Already a coalition of 15 rainforest nations[1] have proposed a plan whereby industrialized nations would pay them to protect their forests to offset greenhouse gas emissions. Meanwhile, last month Brazil — which has the world’s largest extent of tropical rainforests and the world’s highest rate of forest loss — said it will promote a similar initiative at the talks. At stake: potentially billions of dollars for developing countries and the future of the world’s climate.
How would it work?
When trees are cut greenhouse gases are released into the atmosphere — roughly 20 percent of annual emissions of such heat-trapping gases result from deforestation and forest degradation. Avoided deforestation is the concept where countries are paid to prevent deforestation that would otherwise occur. Funds come from industrialized countries seeking to meet emissions commitments under international agreements like the Kyoto Protocol. Policymakers and environmentalists alike find the idea attractive because it could help fight climate change at a low cost while improving living standards for some of the world’s poorest people, safeguarding biodiversity, and preserving other ecosystem services. A number of prominent conservation biologists and development agencies including the World Bank and the U.N. have already endorsed the idea. Even the United States government has voiced support for the plan.
 Tree frog in the Amazon rainforest |
“Avoided deforestation has great potential both in the struggle against global warming and as a means of maintaining Amazonian forest with all of its environmental services, of which carbon storage is only one,” Dr. Philip Fearnside, a Research Professor at the National Institute for Research in the Amazon in Manaus, told mongabay.com in an interview. “The proposals by the Coalition of Rainforest Nations and by Brazil’s Ministry of the Environment are certainly positive.”
“It’s potentially a win-win situation for everybody involved,” said William F. Laurance, a leading rainforest biologist from the Smithsonian Tropical Research Institute in Panama and president of the Association for Tropical Biology and Conservation in a statement earlier this year. “The forests win, the atmosphere wins, the international community wins, and developing nations struggling to overcome poverty win.”
How much money are we talking?
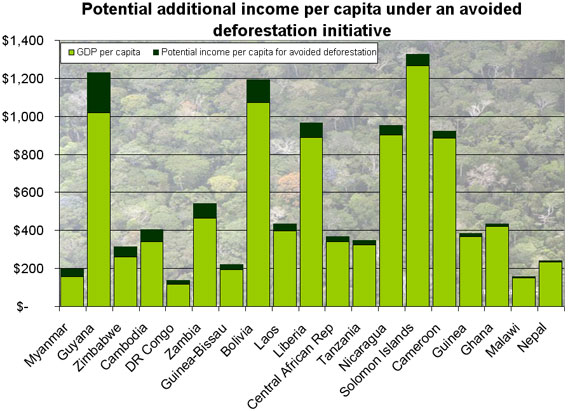
Mongabay.com analysis of U.N. deforestation data suggests that an avoided deforestation scheme could be worth billions to some of the world’s poorest and most indebted countries.
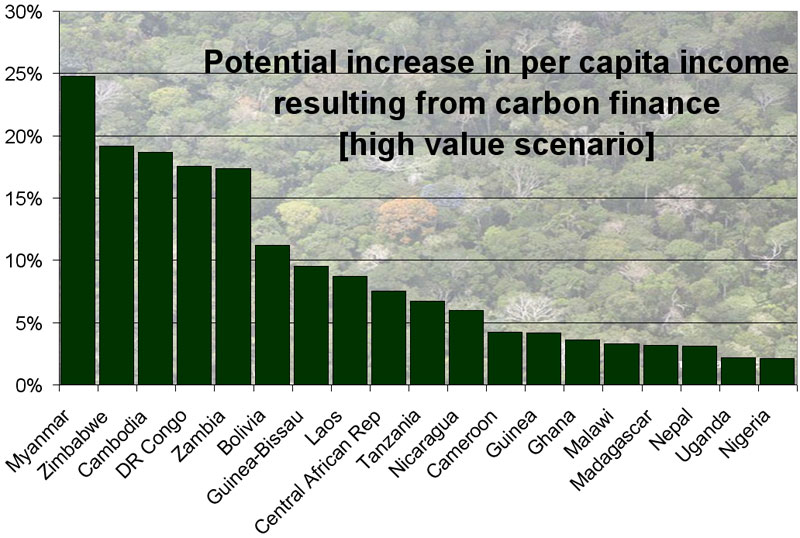 Potential increase in per capita income resulting from carbon finance. For selected countries under a high carbon value ($20 per metric ton) scenario and using exchange rate GDP figures. Please click to enlarge. |
For example, Bolivia, a Latin American country that is a member of the Coalition of Rainforest Nations, lost an average of 270,200 hectares of forest per year between 2000 and 2005 according to figures from the Food and Agriculture Organization of the United Nations (FAO). How much carbon does this represent? At the low end, FAO estimates that each hectare of Bolivian forest stores an average of 67 metric tons of carbon in above-ground biomass (and another 33 tons in below-ground biomass, dead wood, vegetation litter, and soil) that would be otherwise released by deforestation and subsequent land conversion for agriculture or pasture. Other research[2] suggests that net carbon released from deforestation of secondary and primary tropical forest, allowing for the carbon fixed by subsequent land use, is of the order of 100-200 metric tons per hectare. So Bolivian deforestation releases on the order of 67-200 metric tons of carbon for each hectare of cleared or converted for agriculture — further, burning the forest releases not only carbon dioxide (CO2), but carbon monoxide (CO), methane (CH4), nitrogen oxides and other particulate matter. As such, Bolivia’s annual deforestation rate of 270,200 hectares may produce 18-54 million tons (megatons) of carbon emissions per year (66-198 megatons of CO2). Assuming a market rate of $4 per metric ton of carbon dioxide — the current trading price of CCX Carbon Financial Instrument contracts on the Chicago Climate Exchange, but higher in Europe — Bolivia’s avoided deforestation could be worth at minimum $266-$793 million per year. At the higher end, using studies[3] that show “carbon damage” is closer to $20 per ton, avoided deforestation could be valued from $1.33-$3.96 billion per year. Of course determining what constitutes “avoided deforestation” is a matter of definitions but nonetheless for a country with a total income of around $9.6 billion (official exchange rate) funds from avoided deforestation could make a significant economic contribution.
The Math
|
Deforestation rate 270,200 ha per year |
X |
Carbon released per ha: 67-200 tons |
X |
Carbon to CO2 conversion factor 3.67 |
X |
Price per ton of CO2: $4-20 |
= |
Potential value of avoided deforestation: $266 million-$3.96 billion/yr |
Below mongabay.com has tabulated a range of possible values for avoided deforestation in countries that might qualify for carbon finance initiatives and for which there is complete forest data. For these 42 countries, representing over 1.3 billion people, avoided deforestation could be worth $2.7 to $33 billion per year. The biggest payoff would come in poor countries that have high deforestation rates including Zimbabwe, Zambia, Myanmar (Burma), Cambodia, and the Democratic Republic Congo, where an avoided deforestation scheme could theoretically add more than 15 percent to per capita income (as measured by the official exchange rate).
World totals could be even higher if other tropical developing countries, not represented in the table below but that would likely be included in any broad agreement, are factored in to the calculations. Adding Costa Rica, Ecuador, Guyana, Mexico, Papua New Guinea, Peru, Suriname, and Venezuela — countries that had roughly 255 million hectares of forest in 2005 but lose some 1.3 million hectares per year to deforestation — to the equation could boost the value range of avoided deforestation to $4.4-43.5 billion.
One final point: In a report released last week, the World Bank last week estimated that land worth $200-500 per hectare as pasture could be worth $1,500-$10,000 if left as intact forest and used to offset carbon emissions from industrialized countries. Using this figure, avoided deforestation in the 48 countries listed below and in the prior paragraph, could be valued at $14.1-103.3 billion per year more than its value as deforested pasture.
Please note that these figures are based on a simplified model. In practice, calculating the value of avoided deforestation will be more complex.
Calculating the value of avoided deforestation in developing countries: more detailed table
| COUNTRY | Annual deforestation rate 2000-2005 (ha) |
High end estimate of carbon released from deforestation (tons/ha) |
Population (millions) |
GDP (official exchange rate) (millions ) |
GDP (official exchange rate) per capita |
Avoided deforestation value (thousands) |
Avoided deforestation value per captia |
Potential income gain from avoided deforestation payments |
| Myanmar | 466,400 | 200 | 47.38 | $7,464 | $158 | $6,841 | $144 | 91% |
| Zimbabwe | 313,000 | 100 | 12.24 | $3,207 | $262 | $2,295 | $188 | 72% |
| Cambodia | 218,800 | 200 | 13.88 | $4,729 | $341 | $3,209 | $231 | 68% |
| DR Congo | 319,400 | 200 | 62.66 | $7,328 | $117 | $4,685 | $75 | 64% |
| Zambia | 444,800 | 100 | 11.5 | $5,351 | $465 | $3,262 | $284 | 61% |
| Guinea-Bissau | 9,600 | 200 | 1.44 | $280 | $194 | $141 | $98 | 50% |
| Bolivia | 270,200 | 200 | 8.99 | $9,657 | $1,074 | $3,963 | $441 | 41% |
| Laos | 78,000 | 150 | 6.37 | $2,523 | $396 | $858 | $135 | 34% |
| Liberia | 60,200 | 200 | 3.04 | $2,700 | $888 | $883 | $290 | 33% |
| Central African Rep | 29,600 | 200 | 4.3 | $1,462 | $340 | $434 | $101 | 30% |
| Guyana | 15,104 | 200 | 0.77 | $782 | $1,020 | $222 | $288 | 28% |
| Tanzania | 412,200 | 100 | 37.45 | $12,120 | $324 | $3,023 | $81 | 25% |
| Nicaragua | 70,000 | 200 | 5.57 | $5,030 | $903 | $1,027 | $184 | 20% |
| Suriname | 14,776 | 200 | 0.44 | $1,300 | $2,961 | $217 | $493 | 17% |
| Cameroon | 220,000 | 150 | 17.34 | $15,350 | $885 | $2,420 | $140 | 16% |
| Guinea | 36,000 | 200 | 9.69 | $3,576 | $369 | $528 | $54 | 15% |
| Ghana | 115,400 | 150 | 22.41 | $9,413 | $420 | $1,269 | $57 | 13% |
| Malawi | 33,000 | 100 | 13.01 | $1,984 | $152 | $242 | $19 | 12% |
| Nepal | 52,800 | 200 | 28.29 | $6,655 | $235 | $774 | $27 | 12% |
| Madagascar | 37,000 | 200 | 18.6 | $4,719 | $254 | $543 | $29 | 11% |
| Papua New Guinea | 29,437 | 200 | 5.67 | $3,924 | $692 | $432 | $76 | 11% |
| Uganda | 86,400 | 100 | 28.2 | $7,909 | $281 | $634 | $22 | 8% |
| Nigeria | 409,600 | 200 | 131.86 | $77,330 | $586 | $6,007 | $46 | 8% |
| Indonesia | 1,871,400 | 150 | 245.45 | $270,000 | $1,100 | $20,585 | $84 | 8% |
| Brazil | 3,103,000 | 200 | 188.08 | $619,700 | $3,295 | $45,511 | $242 | 7% |
| Mozambique | 50,000 | 100 | 19.69 | $5,727 | $291 | $367 | $19 | 6% |
| Angola | 124,800 | 150 | 12.13 | $24,350 | $2,008 | $1,373 | $113 | 6% |
| Congo | 17,000 | 200 | 3.7 | $4,694 | $1,268 | $249 | $67 | 5% |
| Solomon Islands | 2,172 | 200 | 0.55 | $700 | $1,268 | $32 | $58 | 5% |
| Senegal | 45,000 | 100 | 11.99 | $7,972 | $665 | $330 | $28 | 4% |
| Guatemala | 54,000 | 200 | 12.29 | $26,980 | $2,195 | $792 | $64 | 3% |
| Philippines | 157,400 | 200 | 89.47 | $91,360 | $1,021 | $2,309 | $26 | 3% |
| Gabon | 10,200 | 200 | 1.42 | $6,697 | $4,700 | $150 | $105 | 2% |
| Equatorial Guinea | 15,200 | 150 | 0.54 | $7,644 | $14,153 | $167 | $310 | 2% |
| Tanzania | 35,257 | 100 | 37.45 | $12,120 | $324 | $259 | $7 | 2% |
| Malaysia | 140,200 | 200 | 24.39 | $122,000 | $5,003 | $2,056 | $84 | 2% |
| Peru | 68,742 | 200 | 28.3 | $69,810 | $2,467 | $1,008 | $36 | 1% |
| Argentina | 149,800 | 200 | 39.92 | $182,000 | $4,559 | $2,197 | $55 | 1% |
| Sri Lanka | 29,800 | 100 | 20.22 | $21,620 | $1,069 | $219 | $11 | 1% |
| Kenya | 12,000 | 150 | 34.71 | $16,110 | $464 | $132 | $4 | 1% |
| Colombia | 47,000 | 200 | 43.59 | $97,730 | $2,242 | $689 | $16 | 1% |
| Venezuela | 47,713 | 150 | 25.73 | $106,100 | $4,124 | $525 | $20 | 0% |
| Brunei Darussalam | 2,000 | 200 | 0.38 | $6,000 | $15,813 | $29 | $77 | 0% |
| Ecuador | 10,853 | 175 | 13.6 | $30,700 | $2,257 | $139 | $10 | 0% |
| Panama | 2,600 | 200 | 3.19 | $14,890 | $4,666 | $38 | $12 | 0% |
| Thailand | 58,800 | 100 | 64.63 | $183,900 | $2,845 | $431 | $7 | 0% |
| Haiti | 800 | 150 | 8.31 | $4,321 | $520 | $9 | $1 | 0% |
| Costa Rica | 2,391 | 100 | 4.1 | $19,380 | $4,727 | $18 | $4 | 0% |
| Dominican Republic | 1,376 | 100 | 9.2 | $18,150 | $1,973 | $10 | $1 | 0% |
| Jamaica | 400 | 150 | 2.76 | $9,127 | $3,309 | $4 | $2 | 0% |
| Trinidad and Tobago | 400 | 200 | 1.07 | $13,020 | $12,216 | $6 | $5 | 0% |
| Mauritius | 200 | 200 | 1.24 | $6,681 | $5,384 | $3 | $2 | 0% |
References:
- [1]: As of November 1, 2006, the Coalition of Rainforest Nations includes Bolivia, Central African Republic, Chile, Costa Rica, Democratic Republic of Congo, Dominican Republic, Fiji, Gabon, Guatemala, Nicaragua, Panama, Papua New Guinea, Republic of Congo, the Solomon Islands, and Vanuatu.
- [2]: K.Brown and D.W.Pearce, 1994. The Economic Value of Non-Market Benefits of Tropical
Forests: Carbon Storage. In, J.Weiss (ed), The Economics of Project Appraisal and the
Environment, Edward Elgar, London, 102-123. - [3]: Fankhauser, S., and D. W. Pearce. 1994. “The Social Costs of Greenhouse Gas Emissions.” In: The Economics of Climate Change, Paris: Organisation for Economic Cooperation and Development-International Energy Agency
>