United States economy becomes more carbon efficient — Delaware leads the way, while Nevada has largest increase in emissions
United States economy becomes more carbon efficient — Delaware leads the way, while Nevada has largest increase in emissions
mongabay.com
June 21, 2006
The state of Nevada had the largest increase in carbon emissions between 1990 and 2001 according to mongabay.com’s analysis of figures released by the Energy Information Administration. Carbon dioxide emissions climbed 47 percent during the period, while the state’s economy grew by 85 percent and its population increased by 73 percent. The figures show that Nevada, like the rest of the United States, is becoming getting more out of its carbon dioxide emissions than it did in 1990.
Overall the United States was about 20 percent more carbon dioxide efficient in 2001 than in 1990, with each metric ton of carbon dioxide generating from $1,614 to 1,724 worth of gross domestic product.
Other findings include:
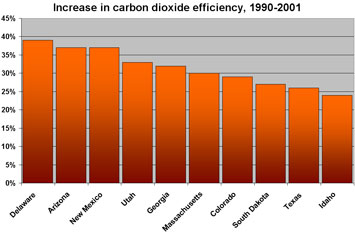
With a 39 percent reduction in carbon intensity — the amount of carbon generated per dollar of gross state product — Delaware had the largest increase in carbon dioxide efficiency, followed by Arizona, New Mexico, Utah, and Georgia.
Texas, the country’s largest polluter in terms of CO2 emissions, saw its carbon dioxide production rise by 19 percent between 1990 and 2001. Still, the increase was outpaced by a 61 percent growth in the economy.
California’s carbon dioxide emissions rose by 6 percent in the period, while the state’s population grew by 15 percent and its gross product by 34 percent.
Fossil fuel emissions — especially carbon dioxide — are blamed by most scientists for increased concentrations of carbon dioxide (CO2) in the atmosphere. The scientific consensus says that higher CO2 levels are behind the recent rise in global temperatures. At 380 parts-per-million, atmospheric carbon dioxide levels are at the level highest in 650,000 years.
|
While the effects of higher temperatures are still poorly understood, scientists are concerned that climate change could have a major impact on weather patterns, the distribution of ice, ecosystems, and ocean currents and sea levels. During this year alone studies have warned that climate change could result in the demise of coral reefs, the shutdown of the Gulf stream and related currents, melting Arctic ice and glaciers, emerging diseases, bitter winters and drought, changes in vegetation, stronger storms and hurricanes, and mass extinction.
Leaders
10 highest carbon dioxide emissions in 2001: Texas (656 million metric tons), California (383), Pennsylvania (262), Ohio (252), Florida (239), Indiana (230), Illinois (227), New York (212), Michigan (181), and Louisiana (165).
10 most carbon efficient states in 2001: District of Columbia, Connecticut, New York, Massachusetts, California, New Jersey Vermont, Rhode Island, Alabama, and Delaware.
10 states with largest improvement in carbon efficiency 1990-2001: Delaware (39%), Arizona (37%), New Mexico (37%), Utah (33%), Georgia (32%), Massachusetts (30%), Colorado (29%), South Dakota (27%), Texas (26%), and Idaho (24%)
Table of full results
State summaries
Alabama, where the population increased by 10% and the economy grew by 34% between 1990 and 2001, had a 26% rise in carbon dioxide emissions to 43.2 million metric tons. During the period, the state became 6% more carbon dioxide efficient.
Alaska, where the population increased by 15% and the economy grew by -19% between 1990 and 2001, had a 20% rise in carbon dioxide emissions to 129.6 million metric tons. During the period, the state became -49% less carbon dioxide efficient.
Arizona, where the population increased by 44% and the economy grew by 101% between 1990 and 2001, had a 27% rise in carbon dioxide emissions to 63.4 million metric tons. During the period, the state became 37% more carbon dioxide efficient.
Arkansas, where the population increased by 14% and the economy grew by 49% between 1990 and 2001, had a 42% rise in carbon dioxide emissions to 88.7 million metric tons. During the period, the state became 4% more carbon dioxide efficient.
California, where the population increased by 15% and the economy grew by 34% between 1990 and 2001, had a 6% rise in carbon dioxide emissions to 383.1 million metric tons. During the period, the state became 21% more carbon dioxide efficient.
Colorado, where the population increased by 34% and the economy grew by 91% between 1990 and 2001, had a 35% rise in carbon dioxide emissions to 88.8 million metric tons. During the period, the state became 29% more carbon dioxide efficient.
Connecticut, where the population increased by 4% and the economy grew by 29% between 1990 and 2001, had a 5% rise in carbon dioxide emissions to 42.6 million metric tons. During the period, the state became 19% more carbon dioxide efficient.
Delaware, where the population increased by 19% and the economy grew by 53% between 1990 and 2001, had a -7% fall in carbon dioxide emissions to 16.4 million metric tons. During the period, the state became 39% more carbon dioxide efficient.
District of Columbia, where the population decreased by -5% and the economy shrunk by 12% between 1990 and 2001, had a -7% fall in carbon dioxide emissions to 4.1 million metric tons. During the period, the state became 17% more carbon dioxide efficient.
Florida, where the population increased by 26% and the economy grew by 51% between 1990 and 2001, had a 27% rise in carbon dioxide emissions to 238.8 million metric tons. During the period, the state became 16% more carbon dioxide efficient.

Record one-year increase in carbon dioxide levels Atmospheric carbon dioxide levels jumped 2.6 parts per million (ppm) in 2005, one of the largest increases on record according to data from the National Oceanic and Atmospheric Administration (NOAA). Carbon dioxide levels now stand at 381 ppm, about 36 percent above pre-industrial levels. |
Georgia, where the population increased by 29% and the economy grew by 70% between 1990 and 2001, had a 16% rise in carbon dioxide emissions to 160.5 million metric tons. During the period, the state became 32% more carbon dioxide efficient.
Hawaii, where the population increased by 10% and the economy grew by -1% between 1990 and 2001, had a -12% fall in carbon dioxide emissions to 19.2 million metric tons. During the period, the state became 11% more carbon dioxide efficient.
Idaho, where the population increased by 31% and the economy grew by 80% between 1990 and 2001, had a 37% rise in carbon dioxide emissions to 15.5 million metric tons. During the period, the state became 24% more carbon dioxide efficient.
Illinois, where the population increased by 9% and the economy grew by 38% between 1990 and 2001, had a 17% rise in carbon dioxide emissions to 227.1 million metric tons. During the period, the state became 15% more carbon dioxide efficient.
Indiana, where the population increased by 10% and the economy grew by 45% between 1990 and 2001, had a 12% rise in carbon dioxide emissions to 230.2 million metric tons. During the period, the state became 23% more carbon dioxide efficient.
Iowa, where the population increased by 5% and the economy grew by 39% between 1990 and 2001, had a 27% rise in carbon dioxide emissions to 79.4 million metric tons. During the period, the state became 9% more carbon dioxide efficient.
Kansas, where the population increased by 9% and the economy grew by 34% between 1990 and 2001, had a 4% rise in carbon dioxide emissions to 71.9 million metric tons. During the period, the state became 23% more carbon dioxide efficient.
Kentucky, where the population increased by 10% and the economy grew by 38% between 1990 and 2001, had a 30% rise in carbon dioxide emissions to 152.2 million metric tons. During the period, the state became 6% more carbon dioxide efficient.
Louisiana, where the population increased by 6% and the economy grew by 6% between 1990 and 2001, had a -8% fall in carbon dioxide emissions to 165.3 million metric tons. During the period, the state became 13% more carbon dioxide efficient.
Maine, where the population increased by 5% and the economy grew by 24% between 1990 and 2001, had a 20% rise in carbon dioxide emissions to 22.7 million metric tons. During the period, the state became 3% more carbon dioxide efficient.
Maryland, where the population increased by 12% and the economy grew by 29% between 1990 and 2001, had a 11% rise in carbon dioxide emissions to 77.4 million metric tons. During the period, the state became 14% more carbon dioxide efficient.
Massachusetts, where the population increased by 6% and the economy grew by 41% between 1990 and 2001, had a 0% fall in carbon dioxide emissions to 83.1 million metric tons. During the period, the state became 30% more carbon dioxide efficient.
Michigan, where the population increased by 7% and the economy grew by 40% between 1990 and 2001, had a 6% rise in carbon dioxide emissions to 192.7 million metric tons. During the period, the state became 24% more carbon dioxide efficient.
Minnesota, where the population increased by 13% and the economy grew by 53% between 1990 and 2001, had a 22% rise in carbon dioxide emissions to 95.9 million metric tons. During the period, the state became 20% more carbon dioxide efficient.
Mississippi, where the population increased by 11% and the economy grew by 37% between 1990 and 2001, had a 44% rise in carbon dioxide emissions to 69 million metric tons. During the period, the state became -5% less carbon dioxide efficient.
Missouri, where the population increased by 10% and the economy grew by 39% between 1990 and 2001, had a 25% rise in carbon dioxide emissions to 129.9 million metric tons. During the period, the state became 10% more carbon dioxide efficient.
Montana, where the population increased by 13% and the economy grew by 34% between 1990 and 2001, had a 18% rise in carbon dioxide emissions to 32.4 million metric tons. During the period, the state became 12% more carbon dioxide efficient.
Nebraska, where the population increased by 8% and the economy grew by 39% between 1990 and 2001, had a 30% rise in carbon dioxide emissions to 42.9 million metric tons. During the period, the state became 6% more carbon dioxide efficient.
Nevada, where the population increased by 73% and the economy grew by 85% between 1990 and 2001, had a 47% rise in carbon dioxide emissions to 44.6 million metric tons. During the period, the state became 21% more carbon dioxide efficient.
New Hampshire, where the population increased by 13% and the economy grew by 57% between 1990 and 2001, had a 21% rise in carbon dioxide emissions to 17.7 million metric tons. During the period, the state became 23% more carbon dioxide efficient.
New Jersey, where the population increased by 10% and the economy grew by 33% between 1990 and 2001, had a 5% rise in carbon dioxide emissions to 120.9 million metric tons. During the period, the state became 21% more carbon dioxide efficient.
New Mexico, where the population increased by 20% and the economy grew by 77% between 1990 and 2001, had a 11% rise in carbon dioxide emissions to 59.2 million metric tons. During the period, the state became 37% more carbon dioxide efficient.
New York, where the population increased by 6% and the economy grew by 27% between 1990 and 2001, had a 2% rise in carbon dioxide emissions to 211.5 million metric tons. During the period, the state became 20% more carbon dioxide efficient.
North Carolina, where the population increased by 23% and the economy grew by 60% between 1990 and 2001, had a 32% rise in carbon dioxide emissions to 145.4 million metric tons. During the period, the state became 18% more carbon dioxide efficient.
North Dakota, where the population decreased by 0% and the economy shrunk by 32% between 1990 and 2001, had a 17% rise in carbon dioxide emissions to 51.8 million metric tons. During the period, the state became 11% more carbon dioxide efficient.
Ohio, where the population increased by 5% and the economy grew by 33% between 1990 and 2001, had a 3% rise in carbon dioxide emissions to 252.3 million metric tons. During the period, the state became 22% more carbon dioxide efficient.
Oklahoma, where the population increased by 10% and the economy grew by 31% between 1990 and 2001, had a 18% rise in carbon dioxide emissions to 104 million metric tons. During the period, the state became 10% more carbon dioxide efficient.
Oregon, where the population increased by 22% and the economy grew by 75% between 1990 and 2001, had a 36% rise in carbon dioxide emissions to 41.6 million metric tons. During the period, the state became 22% more carbon dioxide efficient.
Pennsylvania, where the population increased by 3% and the economy grew by 30% between 1990 and 2001, had a 0% fall in carbon dioxide emissions to 261.9 million metric tons. During the period, the state became 23% more carbon dioxide efficient.
Rhode Island, where the population increased by 5% and the economy grew by 25% between 1990 and 2001, had a 39% rise in carbon dioxide emissions to 12.2 million metric tons. During the period, the state became -11% less carbon dioxide efficient.
South Carolina, where the population increased by 16% and the economy grew by 44% between 1990 and 2001, had a 28% rise in carbon dioxide emissions to 75.5 million metric tons. During the period, the state became 11% more carbon dioxide efficient.
South Dakota, where the population increased by 9% and the economy grew by 57% between 1990 and 2001, had a 14% rise in carbon dioxide emissions to 13.5 million metric tons. During the period, the state became 27% more carbon dioxide efficient.
Tennessee, where the population increased by 17% and the economy grew by 53% between 1990 and 2001, had a 18% rise in carbon dioxide emissions to 121.4 million metric tons. During the period, the state became 23% more carbon dioxide efficient.
Texas, where the population increased by 25% and the economy grew by 61% between 1990 and 2001, had a 19% rise in carbon dioxide emissions to 656.1 million metric tons. During the period, the state became 26% more carbon dioxide efficient.
Utah, where the population increased by 31% and the economy grew by 76% between 1990 and 2001, had a 18% rise in carbon dioxide emissions to 63.4 million metric tons. During the period, the state became 33% more carbon dioxide efficient.
Vermont, where the population increased by 9% and the economy grew by 35% between 1990 and 2001, had a 20% rise in carbon dioxide emissions to 6.5 million metric tons. During the period, the state became 11% more carbon dioxide efficient.
Virginia, where the population increased by 16% and the economy grew by 43% between 1990 and 2001, had a 27% rise in carbon dioxide emissions to 119.9 million metric tons. During the period, the state became 11% more carbon dioxide efficient.
Washington, where the population increased by 22% and the economy grew by 51% between 1990 and 2001, had a 20% rise in carbon dioxide emissions to 84.2 million metric tons. During the period, the state became 20% more carbon dioxide efficient.
West Virginia, where the population increased by 1% and the economy grew by 26% between 1990 and 2001, had a -4% fall in carbon dioxide emissions to 102.3 million metric tons. During the period, the state became 24% more carbon dioxide efficient.
Wisconsin, where the population increased by 10% and the economy grew by 49% between 1990 and 2001, had a 29% rise in carbon dioxide emissions to 109.7 million metric tons. During the period, the state became 13% more carbon dioxide efficient.
Wyoming, where the population increased by 9% and the economy grew by 19% between 1990 and 2001, had a 12% rise in carbon dioxide emissions to 63.3 million metric tons. During the period, the state became 6% more carbon dioxide efficient.