Life expectancy below 40 for some African countries, global population growth rates slow
Rhett A. Butler, mongabay.com
April 16, 2006
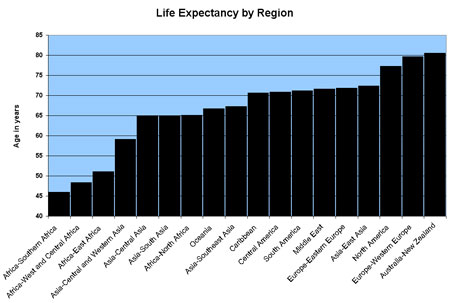
Children born in six African countries can expect to die before their 41st birthday while kids born in 16 countries can expect to live past 80 according to an annual report released by the UN’s World Health Organization.
The report, “World Health Report 2006 – Working together for health”, released earlier this month reveals a widening between the quality of life for the world’s poorest and richest people.
Most of the world’s shortest life expectancies occurs in Africa where the AIDS epidemic, malnutrition, curable diseases, and civil strife have taken a tremendous toll on human life. In all, of the 29 countries where life expectancy at birth is 50 years or less, 28 are in Africa. The only outlier is warn-torn Afghanistan, where life expectancy is 42 years. Of the 40 countries with the shortest life expectancy, 38 are in Africa.
In Iraq, presently one of the world’s most violent countries, life expectancy for babies born in 2004 was 55 years.
The report shows an estimated shortage of almost 4.3 million doctors, midwives, nurses and support workers worldwide. It says the shortage is most severe in the world’s poorest countries, especially in sub-Saharan Africa, where health workers are most needed.
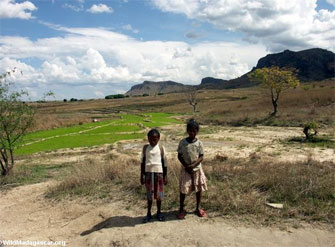
 School children in Madagascar. Photo by R. Butler |
According to the report, the world’s shortest life expectancy occurs in Zimbabwe where strongman Robert Mugabe has held a stranglehold over the once prosperous country for more than 25 years. A child born in Zimbabwe will be lucky to see the age of 37. If she is female, the UN forecasts death by 34.
At the opposite end of the spectrum, a baby born in Japan can expect to live to 82 years. In all, 47 countries have life expectancies exceeding 75 years.
The world’s largest countries, China and India, have life expectancies of 72 and 62 respectively. The discrepancy is expected to have a significant economic impact in coming years and China will have to divert resources from its otherwise booming economy to address the needs of its rapidly aging population.
Slowing population growth
The report also reveals slowing world population growth. Global birth rates fell to the lowest level in recorded history with the average woman in the developing world having 2.9 children, down from an average of nearly 6 babies in the 1970s. UN demographers predict that fertility in most of the developing world will fall below the replacement level (2.1 children per woman) before the end of the 21st century. Factors leading to falling birth rates include increased level education for women, the use of contraceptives, and urbanization.
Of the 192 countries surveyed by the WHO, 66 have fertility rates at or below replacement level. Of these about 20 are considered “less developed” countries and the UN projects that by 2050, 75 percent of less developed countries will be experiencing below-replacement fertility. China, which implemented a strict one-child per family policy in 1979, has the largest drop in fertility rates with an average of 4.3 fewer children per woman since 1970.
While around one-third of countries now have birthrates below replacement level, the lowest fertility rates are in the world’s 44 most developed countries, which account for 19 per cent of the world population. All except Albania have fertility below replacement level and 15, mostly located in Southern and Eastern Europe, have reached levels of fertility unprecedented in human history (below 1.3 children per woman). Japan, Italy, Spain, Germany, and most of the successor States of the former USSR are expected to have significantly lower populations by 2050. In contrast, the United States — which has the highest fertility rate of rich countries — is projected to be the seventh largest contributor to world population growth over the next five decades.
Because of its low and declining rate of population growth, the population of developed countries as a whole is expected to remain virtually unchanged between 2005 and 2050, at about 1.2 billion. In contrast, the population of the 50 least developed countries is projected to more than double, passing from 0.8 billion in 2005 to 1.7 billion in 2050. Some of these country are expected to experience very rapid population growth: between 2005 and 2050, the population is projected to at least triple in Afghanistan, Burkina Faso, Burundi, Chad, Congo, the Democratic Republic of Congo, East Timor, Guinea-Bissau, Liberia, Mali, Niger and Uganda. Growth in the rest of the developing world is also projected to be robust, though less rapid, with its population rising from 4.5 billion to 6.1 billion between 2005 and 2050.

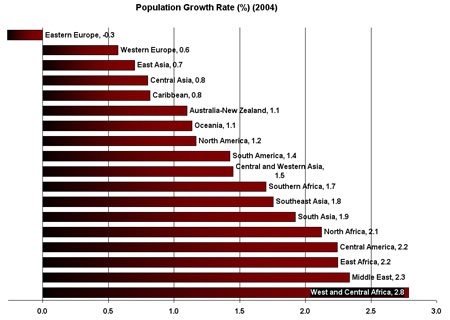
The highest population growth rates are in the Middle East, while the lowest — often negative growth rates — are found in eastern Europe among countries that were once part of the Soviet Union. |
RELATED ARTICLES
Tropical deforestation rates to slow in future – new study
As human population growth rates diminish in coming years deforestation rates are expected to slow according to research published in Biotropica online. The report offers hope that reduced rates of forest conversion can stave off a future extinction crisis in the tropics, where most of the world’s biodiversity is found. Scientists estimate that as much as 50 percent of the planet’s terrestrial biodiversity is found in tropical rainforests distributed around the world but the United Nations recently warned that the current rate of extinction is running 100 to 1,000 times the normal background rate.
Mobilizing seniors to fight poverty in Africa
For all the hype around sending billions of dollars in aid to Africa, it is important to remember that money must be spent wisely. Some of the largest recipients of aid in the past are still some of the world’s poorest countries thanks to corrupt regimes that consumed massive amounts of aid. Direct aid has not only bred corruption and the misallocation of resources away from those who need it most, but it has also fostered dependency and skewed the perceived value of goods and services.
A long-term approach to helping the poor in Africa through private enterprise
This past Saturday millions of people watched the anti-poverty “Live 8” concerts held in London, Tokyo, Johannesburg, Paris, Rome, Berlin, Moscow, Philadelphia and Barrie, Canada. Live 8 coincides with tomorrow’s G8 summit of world leaders and aims to raise awareness of the need for aid, debt relief and fairer trade for Africa. While the cancellation of debt and delivery of aid to Africa is a noble and needed cause for a desparately poor continent, policy makers will need to ensure that funds are spent wisely to maximize the benefits for the largest number of Africans. In the past, aid to the developing world has met mixed reviews. Some of the largest recipients of aid are still some of the world’s poorest countries. What’s going on here? Have aid agencies just been throwing money into a hole?
Cell phones may help “save” Africa
For all the talk about “making poverty history” through aid and debt relief at the G8 meeting in Scotland and among aging rock stars at Live8 concerts, perhaps the best tool for poverty alleviation on the continent is the mobile phone. Yes, that ubiquitous handheld device has done wonders for the poor around the world.
Demographic figures
Total population Annual population growth rate Life expectancy at birth
Both sexesLife expectancy at birth Life expectancy at birth % of population aged 60+ years Total fertility rate
population (000) (%) Both sexes Males Females Total
Country 2004 2004 2004 2004 2004 2004 2004
Afghanistan 28,574,000 3.9 42 42 42 4.4 7.4
Albania 3,112,000 -0.2 72 69 74 11.8 2.2
Algeria 32,358,000 1.6 71 69 72 6.4 2.5
Andorra 67,000 0.7 80 77 83 21.3 1.3
Angola 15,490,000 2.6 40 38 42 4.0 6.7
Antigua and Barbuda 81,000 1.7 72 70 75 10.5 2.3
Argentina 38,372,000 1.1 75 71 78 13.8 2.3
Armenia 3,026,000 -0.8 68 65 72 14.7 1.3
Australia 19,942,000 1.2 81 78 83 17.0 1.7
Austria 8,171,000 0.2 79 76 82 22.3 1.4
Azerbaijan 8,355,000 0.8 65 63 68 9.3 1.8
Bahamas 319,000 1.5 73 70 76 9.1 2.3
Bahrain 716,000 2.4 74 73 75 4.3 2.4
Bangladesh 139,215,000 2.0 62 62 63 5.6 3.2
Barbados 269,000 0.3 75 71 78 13.1 1.5
Belarus 9,811,000 -0.5 68 63 74 18.8 1.2
Belgium 10,400,000 0.3 78 75 81 22.2 1.7
Belize 264,000 2.4 68 65 72 5.9 3.1
Benin 8,177,000 3.2 53 52 53 4.3 5.7
Bhutan 2,116,000 2.2 63 62 65 6.9 4.2
Bolivia 9,009,000 2.1 65 63 66 6.7 3.8
Bosnia and Herzegovina 3,909,000 1.0 73 70 77 18.9 1.3
Botswana 1,769,000 1.1 40 40 40 5.0 3.1
Brazil 183,913,000 1.5 70 67 74 8.7 2.3
Brunei Darussalam 366,000 2.4 77 76 78 4.6 2.4
Bulgaria 7,780,000 -0.7 72 69 76 22.3 1.2
Burkina Faso 12,822,000 3.0 48 47 48 4.3 6.6
Burundi 7,282,000 1.8 45 42 47 4.2 6.8
Cambodia 13,798,000 2.2 54 51 58 5.5 4.0
Cameroon 16,038,000 2.1 50 50 51 5.6 4.5
Canada 31,958,000 1.0 80 78 83 17.5 1.5
Cape Verde 495,000 2.4 70 67 71 5.7 3.6
Central African Republic 3,986,000 1.8 41 40 41 6.1 4.9
Chad 9,448,000 3.3 46 45 48 4.7 6.7
Chile 16,124,000 1.3 77 74 81 11.3 2.0
China 1,315,409,000 0.8 72 70 74 10.8 1.7
Colombia 44,915,000 1.7 73 68 77 7.4 2.6
Comoros 777,000 2.8 64 62 67 4.3 4.7
Congo 3,883,000 3.2 54 53 55 4.5 6.3
Cook Islands 18,000 -0.9 72 70 75 7.5 2.6
Costa Rica 4,253,000 2.3 77 75 80 8.1 2.2
Côte d’Ivoire 17,872,000 2.2 44 41 47 5.2 4.9
Croatia 4,540,000 -0.3 75 72 79 21.9 1.3
Cuba 11,245,000 0.4 78 75 80 14.9 1.6
Cyprus 826,000 1.4 79 77 82 16.5 1.6
Czech Republic 10,229,000 -0.1 76 73 79 19.6 1.2
Democratic People’s Republic of Korea 22,384,000 0.8 66 65 68 10.9 2.0
Democratic Republic of the Congo 55,853,000 2.5 44 42 47 4.3 6.7
Denmark 5,414,000 0.4 78 75 80 20.7 1.8
Djibouti 779,000 2.7 56 54 57 4.6 4.9
Dominica 79,000 0.5 74 72 76 10.5 2.0
Dominican Republic 8,768,000 1.5 67 64 70 6.1 2.7
Ecuador 13,040,000 1.5 72 70 75 8.1 2.7
Egypt 72,642,000 1.9 68 66 70 7.1 3.2
El Salvador 6,762,000 2.0 71 68 74 7.5 2.8
Equatorial Guinea 492,000 2.4 43 42 44 6.0 5.9
Eritrea 4,232,000 3.3 60 58 62 3.9 5.4
Estonia 1,335,000 -1.0 72 66 78 21.5 1.4
Ethiopia 75,600,000 2.6 50 49 51 4.6 5.7
Fiji 841,000 1.0 69 66 71 6.2 2.9
Finland 5,235,000 0.3 79 75 82 20.9 1.7
France 60,257,000 0.4 80 76 83 20.9 1.9
Gabon 1,362,000 2.3 57 55 59 6.2 3.9
Gambia 1,478,000 3.2 57 55 59 5.9 4.6
Georgia 4,518,000 -1.3 74 70 77 18.0 1.4
Germany 82,645,000 0.2 79 76 82 24.8 1.3
Ghana 21,664,000 2.3 57 56 58 5.6 4.2
Greece 11,098,000 0.5 79 77 82 22.9 1.2
Grenada 102,000 0.3 68 66 69 10.5 2.4
Guatemala 12,295,000 2.3 68 65 71 6.1 4.5
Guinea 9,202,000 2.4 53 52 55 5.6 5.8
Guinea—Bissau 1,540,000 2.9 47 45 48 4.8 7.1
Guyana 750,000 0.3 63 62 64 7.3 2.2
Haiti 8,407,000 1.4 55 53 56 6.0 3.9
Honduras 7,048,000 2.6 67 65 70 5.5 3.6
Hungary 10,124,000 -0.2 73 69 77 20.5 1.3
Iceland 292,000 1.0 81 79 83 15.6 2.0
India 1,087,124,000 1.7 62 61 63 7.8 3.0
Indonesia 220,077,000 1.3 67 65 68 8.2 2.3
Iran, Islamic Republic of 68,803,000 1.2 70 68 72 6.4 2.1
Iraq 28,057,000 3.0 55 51 61 4.5 4.7
Ireland 4,080,000 1.3 78 75 81 15.0 1.9
Israel 6,601,000 2.4 80 78 82 13.1 2.8
Italy 58,033,000 0.1 81 78 84 25.3 1.3
Jamaica 2,639,000 0.7 72 70 74 10.1 2.4
Japan 127,923,000 0.2 82 79 86 25.6 1.3
Jordan 5,561,000 3.1 71 69 73 5.0 3.4
Kazakhstan 14,839,000 -0.8 61 56 67 11.4 1.9
Kenya 33,467,000 2.4 51 51 50 4.1 5.0
Kiribati 97,000 2.2 65 63 67 6.5 4.1
Kuwait 2,606,000 4.1 77 76 78 3.0 2.3
Kyrgyzstan 5,204,000 1.4 63 59 67 7.7 2.6
Lao People’s Democratic Republic 5,792,000 2.4 59 58 60 5.3 4.7
Latvia 2,318,000 -0.9 71 66 76 22.3 1.3
Lebanon 3,540,000 1.4 70 68 72 10.2 2.3
Lesotho 1,798,000 0.7 41 39 44 7.4 3.5
Liberia 3,241,000 4.6 42 39 44 3.7 6.8
Libyan Arab Jamahiriya 5,740,000 2.0 72 70 75 6.3 2.9
Lithuania 3,443,000 -0.6 72 66 78 20.5 1.3
Luxembourg 459,000 1.4 79 76 81 18.3 1.7
Madagascar 18,113,000 3.0 57 55 59 4.8 5.3
Malawi 12,608,000 2.4 41 41 41 4.6 6.0
Malaysia 24,894,000 2.3 72 69 74 6.8 2.8
Maldives 321,000 2.8 67 66 68 5.1 4.1
Mali 13,124,000 2.9 46 44 47 4.3 6.8
Malta 400,000 0.7 79 76 81 18.3 1.5
Marshall Islands 60,000 1.7 62 60 64 6.5 4.4
Mauritania 2,980,000 2.9 58 55 60 5.3 5.7
Mauritius 1,233,000 1.1 72 69 75 9.4 2.0
Mexico 105,699,000 1.5 74 72 77 7.6 2.3
Micronesia, Federated States of 110,000 0.4 70 68 71 4.9 4.3
Monaco 35,000 1.1 82 78 85 20.9 1.8
Mongolia 2,614,000 1.0 65 61 69 5.7 2.4
Morocco 31,020,000 1.6 71 69 73 6.8 2.7
Mozambique 19,424,000 2.4 45 44 46 5.2 5.4
Myanmar 50,004,000 1.3 59 56 63 7.4 2.3
Namibia 2,009,000 2.3 54 52 55 5.2 3.8
Nauru 13,000 2.5 61 58 65 6.5 3.8
Nepal 26,591,000 2.3 61 61 61 5.7 3.6
Netherlands 16,226,000 0.5 79 77 81 18.9 1.7
New Zealand 3,989,000 1.0 80 77 82 16.5 2.0
Nicaragua 5,376,000 2.1 69 67 71 4.8 3.2
Niger 13,499,000 3.5 41 42 41 3.3 7.8
Nigeria 128,709,000 2.4 46 45 46 4.8 5.7
Niue 1,000 -2.1 71 68 74 7.5 2.8
Norway 4,598,000 0.6 80 77 82 19.8 1.8
Oman 2,534,000 1.8 74 71 77 4.0 3.6
Pakistan 154,794,000 2.3 62 62 63 5.8 4.1
Palau 20,000 1.6 68 67 70 6.5 1.4
Panama 3,175,000 2.0 76 73 78 8.6 2.7
Papua New Guinea 5,772,000 2.4 60 58 61 3.9 3.9
Paraguay 6,017,000 2.5 72 70 74 5.6 3.8
Peru 27,562,000 1.6 71 69 73 7.6 2.8
Philippines 81,617,000 2.0 68 65 72 6.0 3.1
Poland 38,559,000 0.0 75 71 79 16.7 1.2
Portugal 10,441,000 0.4 78 74 81 22.1 1.5
Qatar 777,000 4.2 76 76 75 2.6 2.9
Republic of Korea 47,645,000 0.7 77 73 80 13.3 1.2
Republic of Moldova 4,218,000 -0.3 67 64 71 13.7 1.2
Romania 21,790,000 -0.5 72 68 76 19.2 1.3
Russian Federation 143,899,000 -0.3 65 59 72 17.3 1.3
Rwanda 8,882,000 4.9 46 44 47 3.9 5.6
Saint Kitts and Nevis 42,000 0.5 71 69 72 10.5 2.4
Saint Lucia 159,000 0.9 74 71 77 9.8 2.2
Saint Vincent and the Grenadines 118,000 0.5 69 66 73 8.9 2.2
Samoa 184,000 1.0 68 66 70 6.5 4.3
San Marino 28,000 0.9 82 79 84 25.3 1.2
Sao Tome and Principe 153,000 2.0 59 57 60 5.8 3.9
Saudi Arabia 23,950,000 2.8 71 68 74 4.5 3.9
Senegal 11,386,000 2.5 55 54 57 4.8 4.9
Serbia and Montenegro 10,510,000 0.0 73 70 75 18.4 1.6
Seychelles 80,000 0.7 72 67 78 9.4 2.1
Sierra Leone 5,336,000 2.6 39 37 40 5.5 6.5
Singapore 4,273,000 2.4 80 77 82 11.8 1.3
Slovakia 5,401,000 0.1 74 70 78 16.0 1.2
Slovenia 1,967,000 0.0 77 73 81 20.2 1.2
Solomon Islands 466,000 2.8 68 66 70 4.1 4.2
Somalia 7,964,000 2.3 44 43 45 4.2 6.3
South Africa 47,208,000 1.4 48 47 49 6.6 2.8
Spain 42,646,000 0.7 80 77 83 21.3 1.3
Sri Lanka 20,570,000 1.0 71 68 75 10.5 1.9
Sudan 35,523,000 2.2 58 56 60 5.6 4.3
Suriname 446,000 0.8 67 65 70 8.9 2.6
Swaziland 1,034,000 1.0 37 36 39 5.3 3.8
Sweden 9,008,000 0.2 81 78 83 23.0 1.7
Switzerland 7,240,000 0.4 81 78 83 21.4 1.4
Syrian Arab Republic 18,582,000 2.6 72 70 74 4.7 3.3
Tajikistan 6,430,000 1.2 63 62 64 5.2 3.7
Thailand 63,694,000 1.0 70 67 73 10.2 1.9
The former Yugoslav Republic of Macedonia 2,030,000 0.4 72 69 76 15.3 1.5
Timor—Leste 887,000 0.5 63 61 66 5.0 7.8
Togo 5,988,000 3.2 54 52 56 4.8 5.2
Tonga 102,000 0.6 71 71 70 8.7 3.4
Trinidad and Tobago 1,301,000 0.4 70 67 73 10.5 1.6
Tunisia 9,995,000 1.2 72 70 74 8.6 1.9
Turkey 72,220,000 1.6 71 69 73 7.9 2.4
Turkmenistan 4,766,000 1.5 60 56 65 6.3 2.7
Tuvalu 10,000 0.6 61 61 62 7.5 3.7
Uganda 27,821,000 3.2 49 48 51 3.9 7.1
Ukraine 46,989,000 -1.0 67 62 73 21.0 1.1
United Arab Emirates 4,284,000 6.4 77 76 79 1.7 2.5
United Kingdom 59,479,000 0.3 79 76 81 21.0 1.7
United Republic of Tanzania 37,627,000 2.3 48 47 49 5.0 4.9
United States of America 295,410,000 1.0 78 75 80 16.5 2.0
Uruguay 3,439,000 0.7 75 71 79 17.4 2.3
Uzbekistan 26,209,000 1.5 66 63 69 6.3 2.7
Vanuatu 207,000 2.1 68 67 69 5.1 4.0
Venezuela, Bolivarian Republic of 26,282,000 2.0 75 72 78 7.4 2.7
Viet Nam 83,123,000 1.5 71 69 74 7.5 2.3
Yemen 20,329,000 3.4 59 57 61 3.7 6.0
Zambia 11,479,000 2.1 40 40 40 4.6 5.5
Zimbabwe 12,936,000 1.1 36 37 34 5.4 3.4
