New measure of wealth accounts for resource depletion, environmental damage
Modified World Bank Press Release
September 18, 2005
Accounting for the actual value of natural resources, including resource depletion and population growth, shows that net savings per person are negative in the world’s most impoverished countries, particularly in sub-Saharan Africa, according to a new World Bank publication, Where is the Wealth of Nations?, launched on the eve of the 2005 U.N. World Summit.
Current indicators used to guide development decisions national accounts figures, such as Gross Domestic Product (GDP) ignore depletion of resources and damage to the environment. In the Conference Edition of Where is the Wealth of Nations?, the World Bank offers new estimates of total wealth, including produced capital, natural resources, and the value of human skills and capabilities, which show that many of the poorest countries in the world are not on a sustainable path.
“New measures of wealth make the social and environmental costs of development decisions visible that are not captured by traditional economics, and thereby allow us to improve actions and policies for sustainable development. Including the value of natural resources and our social capital in national accounting is a vital step to achieve economic growth that is equitable and sustainable,” said Achim Steiner, Director General of the World Conservation Union (IUCN).
The publication offers a ranking of countries according to total wealth, with tables highlighting the 10 wealthiest and the 10 poorest countries (see Annex). Switzerland heads the list of the top-ten performers, the other nine being European countries, the United States, and Japan. Sub-Saharan Africa dominates the bottom-10 list, with Ethiopia having the lowest level of total wealth.
|
“If a household is running down its bank account from month to month, or having to sell assets such as vehicles or livestock in order to keep food on the table, then we would conclude that this household is not sustainable,” explains Kirk Hamilton, Lead Environmental Economist, Environment Department, and the main author of the book. “The same applies to nations as a whole if their net saving rate is negative then this is a signal that national wealth is being run down and the development path is not sustainable.”
The companion booklet, Ensuring Environmental Sustainability, however, highlights that there are important exceptions Mauritania has improved its development prospects through better management of fishery resources, while Botswana has successfully used diamond resources to finance the schooling, health care, and infrastructure which have supported its high rate of growth.
In the case of Botswana, the government makes specific provision in its budget to ensure that mineral revenues are invested rather than consumed through government expenditures. It also maintains a large mineral revenue fund which can both finance future investments and buffer the government budget from swings in diamond prices. This sound combination of macroeconomic and natural resource management has permitted Botswana to avoid the ‘resource curse’ that has afflicted many oil producers.
“Every day, decision makers in developing countries are faced with difficult choices regarding the exploitation of natural resources and the environmental impacts of development programs and policies,” said Ian Johnson, World Bank Vice President for Sustainable Development. “But the tools currently being used are leaving out the natural resources stocks and intangible capital such as knowledge and skills. Sound management of ecosystems is key to a responsible path to growth. This publication challenges common assumptions about how nations generate their wealth.”
With this publication, the World Bank releases what could be termed the ‘millennium capital assessment’, or monetary estimates of the range of resources produced, ecosystems, and intangible upon which development depends. This comprehensive snapshot of wealth for 120 countries at the turn of the millennium aims to deepen the understanding of the linkages between the ability of a country to develop and the level and composition of wealth.
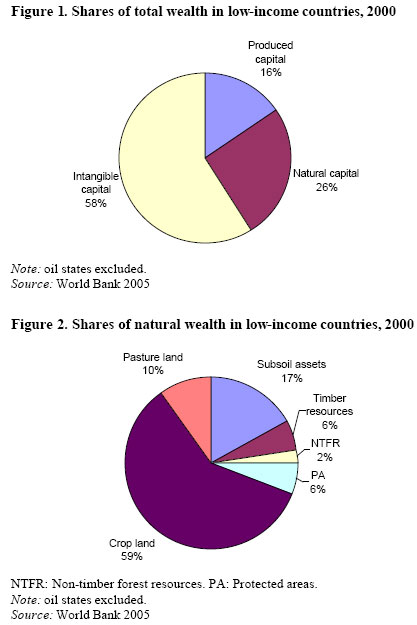
According to Where is the Wealth of Nations?, natural wealth the value of minerals, energy, forests, cropland, pastureland, and protected areas is actually a much higher share of total wealth in low-income countries than produced capital, 26 percent compared with 16 percent.
“Where is the Wealth of Nations further substantiates the realization,” said Steve McCormick, President and CEO, The Nature Conservancy, “that if we can’t get a handle on the deconstruction of natural systems, then we will seriously jeopardize our efforts to make lasting, substantial progress on improving the standard of living of the world’s poorest people. Put simply, healthy ecosystems are the foundation of healthy economies.”
The 7th Millennium Development Goal (MDG) ensure environmental sustainability calls on countries to “reverse the losses of environmental resources” by 2015. Achieving this goal has proven to be elusive for most countries, not least because of a lack of indicators of sustainable development.
“There is a shared sense of urgency about meeting the MDGs,” added Warren Evans, Director of Environment, World Bank, “however, it would be tragic if the achievements of 2015 are not sustained because soils have been mined and fisheries and forests depleted. Avoiding this outcome is the true seventh Millennium Development Goal.”
Measuring the change in total wealth and the change in natural wealth can contribute to a comprehensive measure of whether a development path is sustainable in the long term. The indicators in Where is the Wealth of Nations can guide countries toward a sustainable path.
Summary data from selected appendices in Where is the Wealth of Nations?, a report from the World Bank
More data is available at www.worldbank.org/sustainabledevelopment and more detailed tables can be found at:
- Total Wealth, by country [sort options available]
- Change in Wealth Per Capita, by country
- Genuine savings rates, by country
| Country | gross national income US$ per capita | Total wealth US$ per capita | Adjusted net saving per capita | Change in wealth per capita |
| Albania | 1220 | 17312 | 145 | 122 |
| Algeria | 1670 | 18491 | -93 | -409 |
| Antigua and Barbuda | 8700 | 131849 | 911 | 94 |
| Argentina | 7718 | 139232 | 154 | -109 |
| Australia | 19703 | 371031 | 963 | 46 |
| Austria | 23403 | 493080 | 3032 | 2831 |
| Bangladesh | 373 | 6000 | 71 | 41 |
| Barbados | 9344 | 146737 | 588 | 520 |
| Belgium-Luxembourg | 21756 | 451714 | 2811 | 2649 |
| Belize | 3230 | 52935 | 303 | -150 |
| Benin | 360 | 7895 | 14 | -42 |
| Bhutan | 532 | 7747 | 111 | -111 |
| Bolivia | 969 | 18141 | 9 | -127 |
| Botswana | 2925 | 40592 | 1021 | 814 |
| Brazil | 3432 | 86922 | 265 | 64 |
| Bulgaria | 1504 | 25256 | 80 | 238 |
| Burkina Faso | 230 | 5087 | 15 | -36 |
| Burundi | 97 | 2859 | -10 | -37 |
| Cameroon | 548 | 10753 | -8 | -152 |
| Canada | 22612 | 324979 | 3006 | 2221 |
| Cape Verde | 1195 | 32942 | 43 | -81 |
| Chad | 174 | 4458 | -8 | -74 |
| Chile | 4779 | 77726 | 406 | 129 |
| China | 844 | 9387 | 236 | 200 |
| Colombia | 1926 | 44660 | -6 | -205 |
| Comoros | 367 | 8030 | -17 | -73 |
| Congo, Rep. of | 660 | 3516 | -227 | -727 |
| Costa Rica | 3857 | 61611 | 464 | 107 |
| Cote d’Ivoire | 625 | 14243 | -5 | -100 |
| Denmark | 29009 | 575138 | 4376 | 4014 |
| Dominica | 3344 | 59084 | -53 | 7 |
| Dominican Republic | 2234 | 33410 | 341 | 198 |
| Ecuador | 1170 | 33745 | -51 | -293 |
| Egypt | 1569 | 21879 | 91 | -45 |
| El Salvador | 2075 | 36476 | 113 | 37 |
| Estonia | 3836 | 66769 | 570 | 681 |
| Ethiopia | 101 | 1965 | -4 | -27 |
| Fiji | 2055 | 44880 | -23 | -109 |
| Finland | 22893 | 419346 | 4334 | 4236 |
| France | 22399 | 468024 | 3249 | 2951 |
| Gabon | 3370 | 43168 | -1183 | -2241 |
| Gambia, The | 305 | 6365 | -5 | -45 |
| Georgia | 601 | 13036 | 4 | 16 |
| Germany | 22641 | 496447 | 2180 | 2071 |
| Ghana | 255 | 10365 | 16 | -18 |
| Greece | 10706 | 236972 | 1431 | 1327 |
| Grenada | 3671 | 55312 | 650 | 533 |
| Guatemala | 1676 | 30480 | 37 | -123 |
| Guinea-Bissau | 870 | 3974 | -49 | -108 |
| Guyana | 15810 | |||
| Haiti | 503 | 8235 | 133 | 106 |
| Honduras | 897 | 11567 | 213 | 53 |
| Hungary | 4370 | 77072 | 676 | 765 |
| India | 446 | 6820 | 67 | 16 |
| Indonesia | 675 | 13869 | 20 | -56 |
| Iran | 1580 | 24023 | -142 | -398 |
| Ireland | 21495 | 330490 | 4964 | 4199 |
| Israel | 17354 | 294723 | 1540 | 268 |
| Italy | 18478 | 372666 | 1990 | 1947 |
| Jamaica | 2954 | 47796 | 471 | 371 |
| Japan | 37879 | 493241 | 5906 | 5643 |
| Jordan | 1727 | 31546 | 236 | 28 |
| Kenya | 343 | 6609 | 40 | -11 |
| Korea, Rep. of | 10843 | 141282 | 2694 | 2415 |
| Latvia | 3271 | 47198 | 412 | 551 |
| Lesotho | 15477 | |||
| Madagascar | 245 | 5020 | 9 | -56 |
| Malawi | 162 | 5200 | -2 | -29 |
| Malaysia | 3554 | 46687 | 767 | 227 |
| Mali | 221 | 5241 | 20 | -47 |
| Mauritania | 382 | 7959 | -30 | -147 |
| Mauritius | 3697 | 60284 | 645 | 514 |
| Mexico | 5783 | 61872 | 545 | 155 |
| Moldova | 316 | 8771 | 38 | 56 |
| Morocco | 1131 | 22965 | 200 | 117 |
| Mozambique | 195 | 4232 | 15 | -20 |
| Namibia | 1820 | 36907 | 392 | 140 |
| Nepal | 239 | 3802 | 46 | 2 |
| Netherlands | 23382 | 421389 | 3673 | 3176 |
| New Zealand | 12679 | 242934 | 1550 | 1082 |
| Nicaragua | 739 | 13214 | 81 | -18 |
| Niger | 166 | 3695 | -10 | -83 |
| Nigeria | 297 | 2748 | -97 | -210 |
| Norway | 36800 | 473708 | 6916 | 5708 |
| Pakistan | 517 | 7871 | 54 | -2 |
| Panama | 3857 | 57663 | 829 | 585 |
| Paraguay | 1465 | 35600 | 131 | -93 |
| Peru | 1991 | 39046 | 148 | 15 |
| Philippines | 1033 | 19351 | 211 | 114 |
| Portugal | 10256 | 207477 | 943 | 750 |
| Romania | 1639 | 29113 | 80 | 89 |
| Russian Federation | 1738 | 38709 | -164 | 4 |
| Rwanda | 233 | 5670 | 14 | -60 |
| Senegal | 449 | 10167 | 31 | -27 |
| Seychelles | 7089 | 125572 | 1162 | 904 |
| Singapore | 22968 | 252607 | 8258 | 6949 |
| South Africa | 2837 | 59629 | 246 | -2 |
| Spain | 13723 | 261205 | 1987 | 1663 |
| Sri Lanka | 868 | 14731 | 166 | 116 |
| St. Kitts and Nevis | 6746 | 100167 | 1612 | -63 |
| St. Lucia | 4103 | 66199 | 507 | 253 |
| St. Vincent | 2824 | 49232 | 365 | 336 |
| Suriname | 47128 | |||
| Swaziland | 1375 | 27739 | 129 | 8 |
| Sweden | 26809 | 513424 | 4278 | 4191 |
| Switzerland | 37165 | 648241 | 8611 | 8020 |
| Syrian Arab Rep. | 1064 | 10419 | -175 | -473 |
| Thailand | 1989 | 35854 | 351 | 259 |
| Togo | 285 | 7109 | -20 | -88 |
| Trinidad and Tobago | 5838 | 57549 | -541 | -774 |
| Tunisia | 1936 | 36537 | 291 | 176 |
| Turkey | 2980 | 47859 | 476 | 273 |
| United Kingdom | 24606 | 408753 | 1882 | 1725 |
| United States | 35188 | 512612 | 3092 | 2020 |
| Uruguay | 5962 | 118463 | 137 | 20 |
| Venezuela | 4970 | 45196 | -94 | -847 |
| Zambia | 312 | 6564 | -13 | -63 |
| Zimbabwe | 550 | 9612 | 53 | -4 |
The figures and text above are copyright the World Bank. Further information, along with the full report in PDF form, is available at www.worldbank.org/sustainabledevelopment