Decline of Arctic sea ice increases
Press release from the National Snow and Ice Data Center
September 29, 2005
These maps show the difference between “normal” timing of spring melting (the long-term mean) and when melting started in the year indicated. Melt began earlier on average in all four years, but was most widespread in 2002 and 2005. The 2005 map shows particularly early melt in the region north of the Bering Strait , which is consistent with the warm temperatures observed during the spring and summer. The satellite does not pass directly over the North Pole; this lack of data is indicated by the gray circle in each image. Image courtesy of The National Snow and Ice Data Center |
SUMMARY: Summer Arctic sea ice falls far below average for fourth year, winter ice sees sharp decline, spring melt starts earlier
For the fourth consecutive year, NSIDC and NASA scientists using satellite data have tracked a stunning reduction in arctic sea ice at the end of the northern summer. The persistence of near-record low extents leads the group to conclude that Arctic sea ice is likely on an accelerating, long-term decline.
“Considering the record low amounts of sea ice this year leading up to the month of September, 2005 will almost certainly surpass 2002 as the lowest amount of ice cover in more than a century,” said Julienne Stroeve of NSIDC. If current rates of decline in sea ice continue, the summertime Arctic could be completely ice-free well before the end of this century. (Figure 1: September extent trend, 1978-2005).
 September extent trend, 1978-2005 This graph depicts the decline in sea ice extent from 1978-2005. The September trend from 1979 to 2005, now showing a decline of more than 8 percent per decade, is shown with a straight blue line. The value for 2005 is based on date through September 25; after this date, we assume that ice growth rates are typical for this time of year. Ice extent is obtained by summing the area covered by pixels that have 15 percent or greater ice concentration. The area not imaged by the sensor at the North Pole is assumed to be entirely ice-covered. Image courtesy of The National Snow and Ice Data Center |
Arctic sea ice extent, or the area of ocean that is covered by at least 15 percent ice, typically reaches its minimum in September, at the end of the summer melt season. On September 21, 2005, the five-day running mean sea ice extent dropped to 5.32 million square kilometers (2.05 million square miles), the lowest extent ever observed during the satellite record (Figures 2 and 3: Five-day running mean).
This record covers the period 1978 to the present. A recent assessment of trends throughout the past century indicates that the current decline also exceeds past low ice periods in the 1930s and 1940s (for figures, see Additional Information, below).
For the period 1979 through 2001, before the recent series of low extents, the rate of September decline was slightly more than 6.5 percent per decade. After the September 2002 minimum, which was the record before this year, the trend steepened to 7.3 percent.
Incorporating the 2005 minimum, with a projection for ice growth in the last few days of September, the estimated decline in end-of-summer Arctic sea ice is now approximately 8 percent per decade. All four years have ice extents approximately 20 percent less than the 1978 through 2000 average. This decline in sea ice amounts to approximately 1.3 million square kilometers (500,000 square miles). This is an area roughly equivalent to twice the size of Texas.
Five-day running mean—summer extent anomaly graph 2002-2005 This graph shows the daily ice extent in the summers of 2002-2005. The lines dip to a show a minimum extent each September; the lines bend upward as melting slows and fall begins. All four years are well below the long-term 1979-2000 climatology, which is shown in black (daily climatology values interpolated from monthly means). From July through the beginning of August, the 2005 extent was consistently 1 million square kilometers (360,000 miles) below the long-term mean, and 500,000 square kilometers below the previous three low years. By September 2005, the trend slowed to just below the previous low year in 2002. However, after mid-September, the ice began to melt again, only stopping on September 21. This means that the 2005 minimum came later than any year in the satellite record. The daily arctic total ice extents are calculated from a five-day running mean to eliminate daily variability and provide a clear trend line. Image courtesy of The National Snow and Ice Data Center |
With four consecutive years of low summer ice extent, confidence is strengthening that a long-term decline is underway. Walt Meier of NSIDC said, “Having four years in a row with such low ice extents has never been seen before in the satellite record. It clearly indicates a downward trend, not just a short-term anomaly.”
In addition, however, this year brings with it some new anomalies.
The winter recovery of sea ice extent in the 2004-2005 season was the smallest in the satellite record. Cooler winter temperatures allow the sea ice to “rebound” after summer melting. But with the exception of May 2005, every month since December 2004 has set a new record low ice extent for that month.
Florence Fetterer, of NSIDC, explained how the situation has changed. “Even if sea ice retreated a lot one summer, it would make a comeback the following winter, when temperatures fall well below freezing,” she said. “But in the winter of 2004-2005, sea ice didn’t approach the previous wintertime level.” This lack of recovery means that the sea ice is not building back up after a summer of melting—leaving it even more susceptible to warmer summer temperatures.
Five-day running mean—September minimum concentration anomaly maps, 2002-2005 These maps show the difference between “normal” sea ice extent (long-term mean), and the year indicated. The long-term average minimum extent contour (1979-2000) is in magenta. Blue indicates areas where extent is more than the long-term mean; red shows areas where extent is less than the long-term mean. The 2005 map shows a marked reduction over the past four years, all of which were also below average. In 2002 and 2003, the ice pack also experienced much lower concentrations during the minimum, especially true north of Alaska. However, the ice cover has been much more compact during the minimums of 2004 and 2005, yielding small negative or even positive ice concentration anomalies within the ice pack. Sea Ice extent is a measure of the area that contains at least 15 percent ice. Ice concentration is the fraction of the actual area covered by ice compared to the total area, measured in terms of percentage ice cover. The satellite does not pass directly over the North Pole; this lack of data is indicated by the gray circle in each image. Image courtesy of The National Snow and Ice Data Center |
In mid-September, NSIDC Director Roger Barry spent time in the Laptev Sea on an arctic icebreaker. The ship entered only one area of continuous ice to the east of Severniya Zemvya, one of the most northern island chains of Russia. “That whole area was covered in thick multiyear ice last year, in September of 2004.”
Barry mused about the possible effects of the sea ice decline, including the impact on Arctic animals. “We saw several polar bears quite close to the ship,” he said. “Polar bears must wait out the summer melt season on land, using their stored fat until they can return to the ice. But if winter recovery and sea ice extent continue to decline, how will these beasts survive?”
Since 2002, satellite records have also revealed that springtime melting is beginning unusually early in the areas north of Alaska and Siberia. The 2005 melt season arrived even earlier, beating the mean melt onset date by approximately 17 days, this time throughout the Arctic (Figure 4: Melt onset anomaly maps, 2002-2005).
 Surface temperature anomaly This image shows the difference between 2005 surface air temperatures (averaged for January through August) and the fifty-year mean (1955-2004) for the same months. The preponderance of positive values indicates an unusually warm Arctic in 2005. (NCEP/NCAR Reanalysis; NOAA-CIRES Climate Diagnostics Center ) Image courtesy of The National Snow and Ice Data Center |
In addition, arctic temperatures have increased in recent decades. Compared to the past 50 years, average surface air temperatures from January through August, 2005, were 2 to 3 degrees Celsius (3.6 to 5.4 degrees Fahrenheit) warmer than average across most of the Arctic Ocean (Figure 5: Surface temperature anomaly).
“The year 2005 puts an exclamation point on the pattern of Arctic warming we’ve seen in recent years,” said Mark Serreze of NSIDC.
This summer, the legendary Northwest Passage through the Canadian Arctic from Europe to Asia was completely open except for a 60-mile swath of scattered ice floes. In earlier centuries, whole expeditions were lost as their crews tried to beat through thick ice and bitter cold. The Northeast Passage, north of the Siberian coast, was completely ice-free from August 15 through September 28 (Figure 6: Satellite image of Northwest Passage, September 2005).
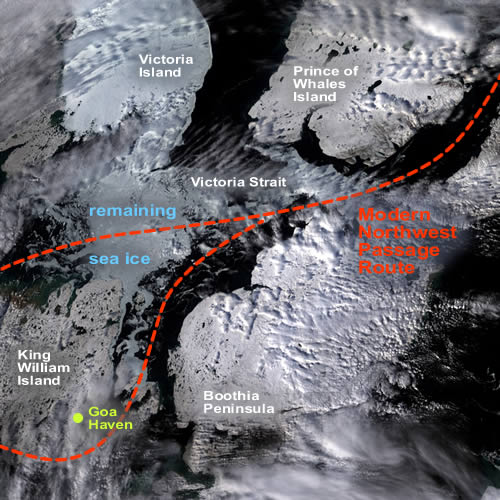 Satellite image of Northwest Passage, September 2005 This satellite image shows ice conditions in the Northwest Passage on September 13, 2005. Only 40 miles of scattered ice obstructed Victoria Strait. In previous years, the Northwest Passage was heavily clotted with sea ice—the first expedition to successfully make the voyage was Amundsen’s, in 1905. The team took more than 2 years to complete the journey through the icepack. On September 13, 2005, Amundsen’s route was nearly ice-free. (Moderate-Resolution Imaging Spectroradiometer image) |
“The sea ice cover seems to be rapidly changing and the best explanation for this is rising temperatures,” Serreze said.
The trend in sea ice decline, lack of winter recovery, early onset of spring melting, and warmer-than-average temperatures suggest a system that is trapped in a loop of positive feedbacks, in which responses to inputs into the system cause it to shift even further away from normal.
One of these positive feedbacks centers on increasingly warm temperatures. Serreze explained that as sea ice declines because of warmer temperatures, the loss of ice is likely to lead to still-further ice losses. Sea ice reflects much of the sun’s radiation back into space, whereas dark ice-free ocean absorbs more of the sun’s energy. As sea ice melts, Earth’s overall albedo, the fraction of energy reflected away from the planet, decreases. The increased absorption of energy further warms the planet.
“Feedbacks in the system are starting to take hold,” argues NSIDC Lead Scientist Ted Scambos. Moreover, these feedbacks could change our estimate of the rate of decline of sea ice. “Right now, our projections for the future use a steady linear decline, but when feedbacks are involved the decline is not necessarily steady—it could pick up speed.”
The arctic system is large and complex, and there are many factors driving change in the region. For example, scientists believe that the Arctic Oscillation, a major atmospheric circulation pattern that can push sea ice out of the Arctic, may have contributed to the sea-ice reduction in the mid-1990s. However, the pattern has become less of an influence in the region since the late 1990s, and yet sea ice has continued to decline.
RELATED ARTICLES Is there a link between the Arctic and hurricanes? – 29-September-2005 Capturing and storing the carbon dioxide could be key in minimizing climate change – 26-September-2005 Summers in arctic getting longer and hotter – 23-September-2005 Hurricane Katrina damage just a dose of what’s to come 21-September-2005 90% of largest companies concerned about climate change — survey 18-September-2005 Humans impacted climate thousands of years ago September 9, 2005 Carbon reinjection strategies to be affected by climate change September 8, 2005 Ocean gas hydrates could trigger catastrophic climate change September 6, 2005 Global warming may have triggered worst mass extinction August 29, 2005 |
On his arctic cruise, Barry saw another example of a factor that contributes to changes in the Arctic. “Warm water flowing from the Atlantic is persisting in the Siberian arctic in a layer 100 to 400 meters, or 109 to 437 yards, below the surface,” Barry said. Heat is probably transferring upward from this layer, helping to maintain open water conditions.
Scientists point out that a longer record of data will continue to help them better examine, piece apart, and understand both the influences and the remarkable changes that they are now seeing.
Scientists who collaborated on this study work at the NASA Goddard Space Flight Center in Greenbelt, Maryland; the NASA Jet Propulsion Laboratory in Pasadena, California; NSIDC at the University of Colorado in Boulder, Colorado; and the University of Washington in Seattle, Washington.
Studies of arctic sea ice extent are funded by NASA and NOAA. In assessing present-day Arctic sea ice extent, researchers used data from NASA, NOAA, U.S. Department of Defense, and Canadian satellites and weather observing stations.
This is a joint press release between the National Snow and Ice Data Center (NSIDC), a part of the Cooperative Institute for Research in Environmental Sciences at the University of Colorado, Boulder; NASA; and the University of Washington.
Media Relations Contacts:
Stephanie Renfrow, NSIDC, 303-492-1497
Jim Scott, University of Colorado at Boulder, 303-492-3114
Download a PDF (303 KB) version of this release.
Joint Releases
Nasa Watches Arctic Ice
University of Colorado, Boulder
Additional Information
All About Sea Ice
General information about sea ice
Global climate, trends, wildlife
Ice development
Ice growth, melt, and cycle
Remote sensing and modeling
NSIDC Sea Ice Index
Images, animations, and trends (September numbers updated first week of October).
State of the Cryosphere
Overview of sea ice extent and its importance; content last updated March 2005.
Arctic Climate Impact Assessment (ACIA)
Visit the ACIA site to view graphics and explanations about sea ice in Impacts of a Warming Arctic report.
Changes in other areas: Greenland Melt Extent, 2005
Further Reading
Meier, W., J. Stroeve, F. Fetterer, and K. Knowles. 2005. Reductions in Arctic sea ice cover no longer limited to summer. EOS 86:326-327.
Overpeck, J., M. Sturm, J. Francis, D. Perovich, et al. 2005. Arctic system on trajectory to new, seasonally ice-free state. EOS 86:309-313.
Serreze, M.C., and J.A. Francis. 2005. The Arctic amplification debate. Climatic Change, in press.
Lindsay, R.W., and J. Zhang. 2005. The thinning of Arctic sea ice, 1988-2003: Have we passed a tipping point? Journal of Climate, in press.
Stroeve, J., M.C. Serreze, F. Fetterer, T. Arbetter, W. Meier, J. Maslanik, K. Knowles. 2005. Tracking the Arctic’s shrinking ice cover; another extreme September sea ice minimum in 2004. Geophysical Research Letters, 32, L04501, doi:10.1029/2004GL021810.
This article is a modified press release from the National Snow and Ice Data Center.