
- A new online platform called Resource Watch makes over 200 geographically referenced global-scale data sets available for viewing and analysis.
- You can view and overlay spatial data layers on your own or explore analyses produced by the platform’s research staff.
- The developers hope that assembling a broad collection of environmental, economic, infrastructure, and social data in a single platform will promote understanding of the connections between human activities and natural systems and encourage more sustainable decision-making.
How does a country’s per capita Gross Domestic Product relate to its forest or biodiversity intactness? Where do areas of deposits of minerals or fossil fuels coincide with the singular habitats of highly endemic species? Which areas of key cereal crops are likely to experience water stress or erosion in the near future?
A new online data platform may help us answer these and similar environmental questions.

Environmental information about our planet, such as land use changes at individual sites or across broad regions, is becoming increasingly available, thanks to aerial and ground data collection technologies. Similarly, improved access and communications have enabled researchers to compile global-scale socioeconomic data sets.
A team of institutions, led by World Resources Institute (WRI), launched an open-source data platform, called Resource Watch, earlier this month. The new platform pulls together and organizes over 200 spatially referenced data sets relevant to economic development and natural resource management.
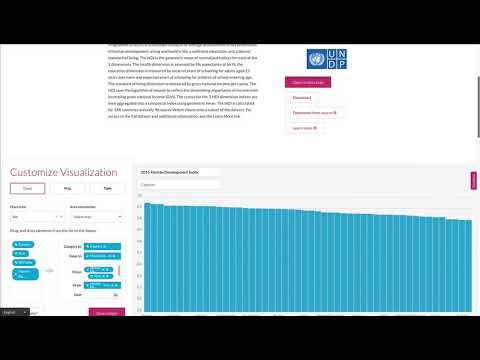
It allows the user to freely download or view these data on maps or, in some cases, as graphs or charts. The site also offers analyses of specific data sets curated by WRI research staff.
The aim for the new platform is to allow anyone with internet access to better understand the interconnectedness of human and natural activities by making it easy for you to spatially overlay any of a variety of global and regional-scale environmental and economic data sets.

An array of environmental and human data
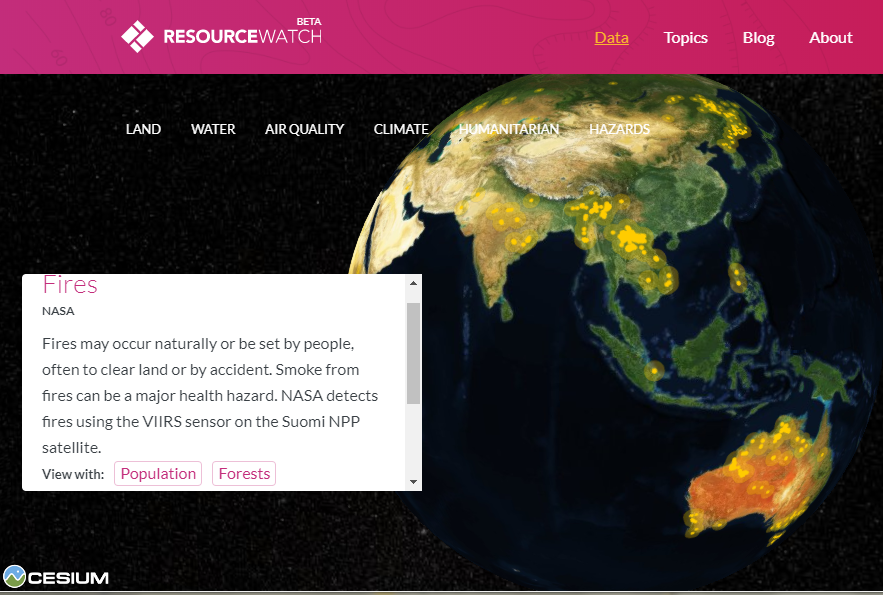
Similar to data layers in Global Forest Watch (GFW), the Resource Watch data sets are geographically referenced on the globe. This new platform runs on Google Earth Engine and displays data over a movable globe that resembles Google Earth.
Resource Watch expressly encourages you to overlay data layers to reveal patterns and places where issues intersect. You can, for example, compare a map of forest cover with official protected areas or with areas likely to experience urban expansion by 2030. Or, you might overlay a data layer of undiscovered oil and gas resources with one showing areas of key endangered species’ habitats, which suggests areas of future conflict.
The broad range of data includes layers of the current status, ongoing change, and predicted change in natural and human systems, including all the global-scale data sets of GFW. Examples include:
Current status
- Natural systems: tree cover, coral reefs, roadless areas, endemic bird areas
- Infrastructure: roads, reservoirs and dams, protected areas, human settlements
- Economic development: agricultural employment, Gross Domestic Product per capita, access to electricity, undiscovered oil and gas resources
Ongoing change
- Coral bleaching
- Trends in production of major grain crops
- Tree cover loss
Predicted change
- Projected water stress
- Projected urban expansion
- Floods, erosion, and risks
- Fisheries vulnerable to climate change

Many of these data sets are available elsewhere, but having data on natural and human systems in one place enables the user to more easily view and quantify spatial relationships between issues, such as poverty and forest loss, or urban infrastructure and air quality.
“We know that the world’s principal sustainability challenges – climate change, food security, land degradation, water scarcity, and more – are deeply intertwined. The problem is, too often people and data are stuck in silos,” said WRI’s Vice President of Science and Research, Janet Ranganathan.
Ranganathan added that the key strengths of the Resource Watch platform were both the compilation of a large number of datasets in one place and the data management done by WRI experts that enables public and private sector decision-makers, NGOs, and the media to visualize how different types of information intersect.
The Topics page, for instance, offers the research team’s summarized global and regional findings on issues related to forests, cities, climate, oceans, energy, food, society, and water.

Selecting the Oceans topic provides findings and graphics on coastal inhabitants, their dependence on coral reefs, fishing vessel movements, marine protected areas, and sea level rise and surface temperatures. Findings for Energy include figures on global access to electricity and cooking fuels, energy demand, origin, efficiency and greenhouse gas emissions. Most findings are current or even predictive, though some date back to the early 2000s.
The Planet Pulse section provides snapshots of the current global status of 18 data sets in similar key natural and human indices presented as layers overlaying an interactive globe. The data are recent – the layers include the vegetation health index or coral reef bleaching alerts from the latest week, conflict and protest events and a drought index based on precipitation and evapotranspiration from the past 30 days, and an air quality measure based on data from the past 24 hours.
Once selected, several of the data sets suggest other layers that you might overlay with the current one—such as adding regions of active cropland to the global map of current vegetation health.
The “App Gallery” provides links to 28 additional online sites, managed by the Resource Watch community, that provide information in the form of maps and apps. Examples include:
- The Surging Seas analysis done by Climate Central shows, for areas within the United States, the risks of sea level rise and coastal flooding in one’s own neighborhood or other area of interest.
- The Mapping Ocean Wealth online platform combines global maps, regional studies, and other data to show the economic values of tourism, coastal protection, reef fisheries, and even soil organic carbon from mangroves, to communities across the globe.
- ESRI’s ArcGIS Living Atlas of the World, which brings together a wide variety of maps and map data from around the world. They include basemaps, boundaries, imagery, and a broad range of economic, infrastructure and environmental data.
Other ways to use the data sets
You can freely use or download the data on Resource Watch for your own analyses. Descriptions of each data set provide details on the licensing and limitations of the data, also explained in this video:
Besides exploring individual data sets online, you can register to receive email alerts of changes in a particular data set for a particular place. If you want to know whether wildfires have hit a particular country or region, you can set an alert to receive notification when the fire occurrence reaches your specific threshold.
You can create an online data dashboard with specific data sets, maps, visualizations, and other information you want to view together in the future. You can link to or share the dashboard page, and if a new version of any of the data sets is uploaded to the platform, your dashboard will update as well.
App developers can uses the Resource Watch application programming interface (API) to develop their own app or tool. The open-source platform has a public API, so you can use the source code and integrate the data into your own app.
Data about the data
The Resource Watch team acquires new data from publicly available sources and partnerships; it also produces new data by funding or conducting its own research.
WRI says its research team looks for data sets generated using established or transparent methods. They aim for peer-reviewed data sets with the highest possible spatial resolution, long time periods, and broad geographic coverage. Nevertheless, spatial resolution, spatial extent, time period covered, frequency of updates, and collection methods differ from one data set to the next, so users should read the metadata (details) about each data layer before drawing conclusions.

The site provides substantial metadata for each data set. These descriptions include the layer’s title, source, description, data type, geographic coverage, time period represented, frequency of updates, spatial resolution, cautions, license for use, and how to cite the data.
WRI’s research team expects to continue adding new data sets to Resource Watch as they become available. The broad assemblage of disparate information is aimed at helping decision-makers and communicators understand where and how human activity corresponds to and affects natural systems and see the connections between our collective actions and the quality of human and ecosystem health.
FEEDBACK: Use this form to send a message to the editor of this post. If you want to post a public comment, you can do that at the bottom of the page.