- The Global Land Analysis & Discovery (GLAD) alert system accessed in Global Forest Watch uses satellite imagery to detect forest loss in areas as small as 30 m x 30 m.
- The system accesses and analyzes Landsat imagery for a subscriber’s area of interest, every week, and sends alerts of tree cover loss via email that enable users to respond to deforestation while it is still in its early stages.
- The alert system is now available for 22 countries and will expand to remaining humid tropical forests in the coming months.
A satellite-based alert system can now detect fine-scale deforestation in near-real time, enabling managers or rangers in tropical forests to respond to early stages of deforestation.
Anyone can now register to receive free weekly alerts of tree cover loss, created by the Global Land Analysis & Discovery (GLAD) lab at the University of Maryland, through Global Forest Watch (GFW), the online forest change monitoring platform. The GLAD alerts identify areas of likely recent tree cover loss within pixels of 30 meters on each side.
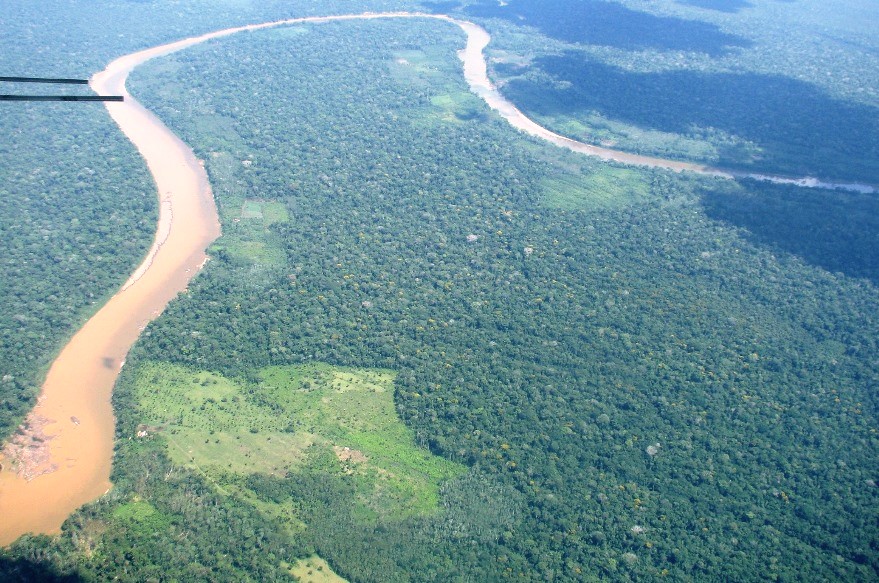
Advance warnings at this scale could facilitate more timely, and therefore more effective and efficient, interventions to activities such as illegal tree cutting along roads or existing clearings. They would likely help the manager of a forestry concession, ecotourism lodge, or state park quickly locate and verify a report that forest has been cut down illegally inside the area, without having to hire a plane or continuously send out patrols across the area.
Near-real-time forest loss alerts can also facilitate forest monitoring by providing agency officials or NGOs with up-to-date information about patterns of deforestation for their species range, protected area, region, or country.
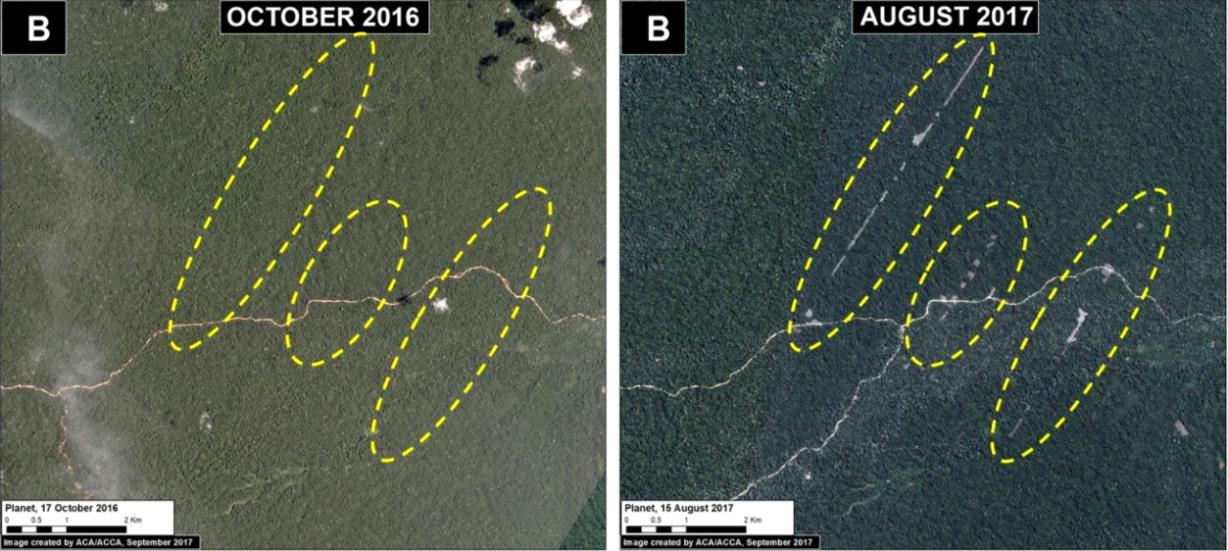
For example, the Monitoring of the Andean Amazon Project (MAAP) uses GLAD alerts as a first step in identifying deforestation hotspots in the Peruvian Amazon. The MAAP team uses new alerts of tree cover loss to investigate deforestation events. They follow up on the alerts of particular interest among thousands in the region by viewing them with other spatial data in a GIS or with high-resolution satellite imagery to help determine what caused the loss of tree cover.
GLAD alerts now function on GFW for 22 countries across nearly all of the Amazon basin, much of the Congo basin, and insular Southeast Asia. GLAD lab remote sensing scientist Matthew Hansen expects the alerts to be available for all humid tropical forests in the coming months.
What triggers forest loss alerts?
GFW provides users with open access to annually updated satellite imagery and several tools to view, download, and analyze it to better understand where forests are expanding and disappearing. Previous Mongabay-Wildtech posts have introduced some of GFW’s general features and analysis tools.
As new Landsat 7 and Landsat 8 satellite images become available from the U.S. Geological Survey (USGS EROS), the GLAD lab assesses them for cloud cover and data quality. It then compares the components of their signals to those over the three previous years and uses decision-making software to calculate a probability of forest disturbance for each pixel of the new image. Pixels with a loss probability greater than 50% are reported as having experienced forest loss.

GLAD forest loss alerts are triggered when this threshold portion of a given 30 m x 30 m pixel (roughly 1/10 of a hectare or 1/4 of an acre) changes from forest cover to non-forest cover. At 30-meter resolution, GLAD alerts are fine enough to detect loss from activities like logging, illegal mining, and small-holder agriculture, all major drivers of deforestation that were too small-scale to be detected by previous alert systems.
Alerts are triggered with every new, cloud-free Landsat image (as frequently as every eight days, depending on the location) and are updated weekly on the GFW website. If pixels within your target area lose forest, you receive an alert via email.
The use of Landsat data does limit the generation of alerts to those detected by visible light and short-wave infrared, as it cannot see through clouds. Some tropical rainforests retain extensive cloud cover for months, during which the satellites cannot collect images, which could delay the detection of tree cover loss. Secondly, GLAD alerts represent deforestation, as the Landsat sensors cannot reliably detect forest degradation from activities such as fuelwood collection, that leave the forest canopy intact.

How to receive alerts for your selected area (details for those interested)
To use the system, you first need to register on the GFW website. When you sign in, you follow several drop-down menus to create a new subscription.
You will select the type of area for which you want to receive alerts. You can select a country, national park, or other area from the GFW database, draw an area on the Interactive Map, or upload your own spatial data. You then “Subscribe,” which asks you to create a profile and log in, and provide the email where you would like to receive alerts.
You can also enter the GFW Interactive Map and subscribe to a new area at any time, whether or not it’s in the GFW database.
If the area exists as a shape in GFW (e.g. a country or protected area)
- For a country or region, click on the Analyze and Subscribe tab atop the menu box at the right-hand side of the map, then choose “Country or Region” and select your target country from the drop-down menu. Then skip to step 5, below.
 |
 |
 |
| Icons and options for selecting an area to monitor using the forest change alerts. The Analyze and Subscribe tab is at the upper left. Image credit: Global Forest Watch | The Analyze and Subscribe tab showing the “Country or Region” options. Image credit: Global Forest Watch | The Analyze and Subscribe tab showing the “Other Data Layers” instructions. Image credit: Global Forest Watch |
- For other types of areas, choose “Other Data Layers” and follow instructions to click on one of the tabs above the map (e.g. Land Use, Conservation) to select the data set containing the area of interest for which you want to receive alerts. You can subscribe to a shape within any data set made up of polygons, including tree plantations, mining concessions, protected areas, and various country-specific data sets.
- Select the data layer and zoom in to your area of interest. The data layer will appear in the left-hand menu. Keep zooming in to get to your specific polygon.
- Click on the shape in the map, such as a national park or forest reserve, for which you want to receive alerts.
- Click the green “Subscribe” buttonin the pop-up window, and you will be prompted to Log In using your Twitter, Facebook, or Google account.
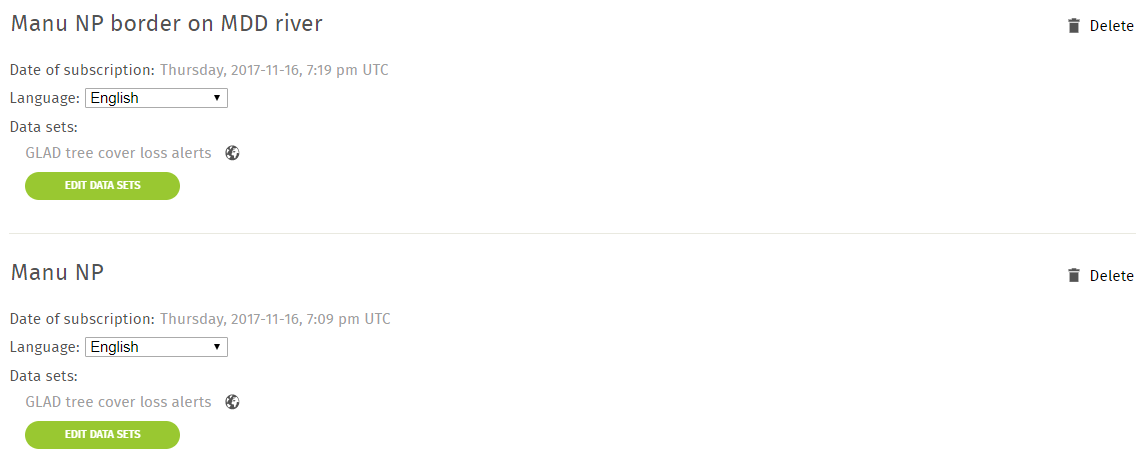
- You can then enter the data you’re subscribing to (click box for GLAD tree cover alerts), the email address to receive the notifications, and a name for this subscription. You’ll need to confirm the subscription by clinking on a link that gets sent to this email address.

You can create multiple subscriptions to receive alerts for different areas. You can view and manage each subscription once it’s been confirmed (see below).
 |
If the shape does not exist in GFW (e.g. a private concession or community reserve)
You can also draw a shape or upload your own spatial data for an area not in the GFW database by following a similar process.
- Enter the Interactive Map as before.
- Turn on the Forest Change data layer you wish to subscribe to (e.g., tree cover loss), as above. You may want to set the forest density higher for rainforest and lower for dry forest. You can also set the time period of loss in the sliding bar at the bottom of the map.
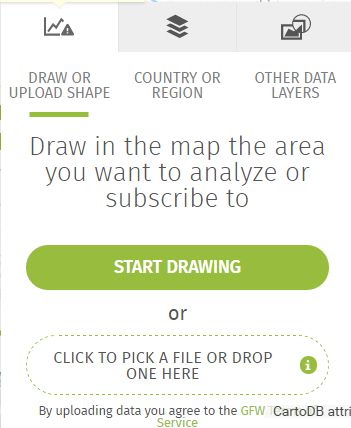
- Select the Analyze and Subscribe icon on the right-hand side of the map, and choose “Draw or Upload Shape.”
3a) To upload your own spatial data
- You can upload a file with your area of interest in a number of formats, including text, Google Maps, JavaScript, Shapefile, and several GIS and markup languages. ESRI shapefiles must be in zipped format and include .shp, .shx, .dbf, and .prj files. All files must contain polygon data, as the alerts tool counts hectares and alerts within polygons, and no larger than 1 MB.
- Click the option that says “Click to Pick a File or Drop One Here” to select a data set from your computer to upload. You can also drag a data set directly from your computer’s file manager.
- Your shape(s) should first show up on the map, with the analysis results appearing in the right-hand window. If your uploaded file contains more than one polygon, the analysis tool will display the summed forest change results for all the shapes in the layer.
- Note: You can drag the points of a shape to edit it once it’s uploaded to the map.
- You can then sign up to receive forest change alerts for this area by clicking the “Subscribe” You will then be prompted to enter the subscription data, as in step 6, above, or either log in if needed.
3b) To draw the shape yourself
- If neither you nor GFW has a file with the area you want monitored, you can draw the shape yourself, by selecting the Draw option from this same menu. A map appears which you can move and zoom in to where you want to draw the shape.
- Clicking the Start Drawing button lets you click points in the shape of a polygon. Click on the first point or double-click to complete the polygon.
- Note: You can drag the points to edit your shape after you’ve finished drawing.
- The Analyze and Subscribe window will show the results of GFW’s quick analysis of this newly defined area. Click the Subscribe button to receive alerts for this new area, and follow the steps as shown above (logging in if you haven’t already, and describing the new subscription).
Viewing and managing the alerts
GLAD alerts show up in your email with the geographic coordinates of each pixel where tree cover loss was detected. You can then choose to view the alerts on the GFW Interactive Map or download the data as a text file.

Colored pixels on the Map represent the areas that have likely experienced recent forest loss and triggered the alert.
You can also see your subscriptions from within GFW using the My GFW person icon at the top of the screen.
GFW answers Frequently Asked Questions and provides a how-to page with more details on how to subscribe to tree cover loss alerts. It also provides instructions on how to view and manage your alert subscriptions, using the My GFW person icon at the top of the Interactive Map.

References
Hansen, M.C., Potapov, P.V., Moore, R., et al. (2013). High-resolution global maps of 21st-century forest cover change. Science, 342, 850-853.
Hansen, M.C., Krylov, A., Tyukavina, A., et al. (2016). Humid tropical forest disturbance alerts using Landsat data. Environmental Research Letters, 11, p.034008.
Monitoring of the Andean Amazon Project (MAAP). (2017). Amazon Conservation Association. Available at: http://maaproject.org/methodology/ and http://maaproject.org/2016/gladalerts/