- A new online mapping platform offers spatial data, mapping tools, hosting space, and advice/consulting services to help increase transparency in land use decision-making.
- Map for Environment was created to be an open repository for environmental data with simple data management and map publishing tools, especially for non-technical users.
- The platform provides the space and the tools for a decentralized community to share data and produce maps with minimal cost and hassle; for this to succeed, the environmental movement must embrace open-data principles and make critical data more broadly available.
As the (English) saying goes, a picture is worth a thousand words. Maps, too, convey a wealth of information in a small space and are doing so more accurately and with more customized information, than ever before.
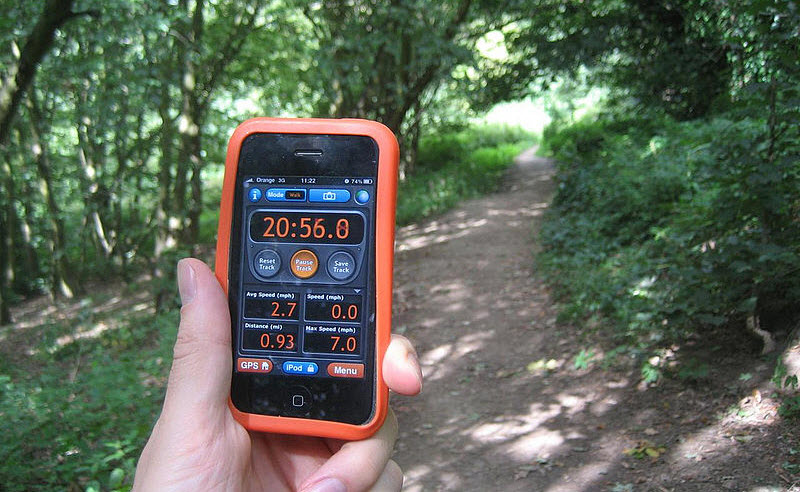
Remote sensing now lets us monitor forest cover, over time, at global and local scales, while GPS units allow explorers and scientists on foot to add data to a specific point on the Earth.
However, accessing, combining, and interpreting those data are still challenging. Environmental, demographic, land use, and infrastructure data are frequently stored privately or in government agencies, making them difficult to access at the scale and resolution needed for monitoring. Powerful mapping platforms tend to be very expensive, though some academic and non-profit institutions have lower-cost licenses to ArcGIS, the most common GIS platform, which also offers a free, limited-use, online version. Most free GIS software, such as QGIS, requires users to have some training and data access.
A new online mapping platform called Map for Environment offers spatial data, basic mapping tools, hosting space, and advice/consulting services for people who want to make maps but don’t need to conduct extensive analyses. These allow the user to:
- Use one or more of the platform’s pre-made maps or data layers
- Upload data (e.g., shapefiles, geojson, kml, csv) or link data from another service (e.g., ArcGIS online, raster hosting service such as Amazon Web Services)
- Manage the data using simple editing and cartography tools
- Make maps, stories, or mini websites called “Hubs” for sharing and embedding
- Host and share data on an institutionally neutral space.
A conservationist – technologist team created Map for Environment to increase transparency in decision-making by making it easy for beginners to produce maps of human activities—such as logging roads, agriculture, dams, and fracking wells—on the landscape. Rather than recreate a Geographic Information System (GIS) with comprehensive analysis capability, the open-source platform hosts a catalog of contributed environment and development spatial data at various scales, though the number and types of data sets varies by country (i.e. some countries have multiple local or national-level data, whereas, others have none). It also provides open access to some basic mapping tools to enable users to view, manage, and share the data layers and quickly publish a map in one of several formats.
Leo Bottrill, founder and CEO of Map for Environment (M4E), and colleagues began building earlier iterations of M4E in 2011 through Moabi DRC, an initiative that collaboratively monitors natural resource use in the Democratic Republic of the Congo and includes a public database of deforestation drivers in DRC and REDD+ mapping data.
Mongabay-Wildtech asked Bottrill about the new platform, why he and the Chief Technology Officer, Kristofor Carle, developed it, and the types of users it targets.
MB-WT: What inspired you to develop a new mapping platform?
Bottrill: We wanted to build a simple way to share mapping data between multiple organizations regarding drivers of deforestation and bring transparency to an opaque REDD+ process. We began experimenting with different technology but wanted mapping tools that were 100% open-source and simple to use, which led us to use OpenStreetMap – the Wikipedia of maps.
We learned a number of lessons from implementing Moabi that inform the creation of M4E and MapHubs – the technology that underpins it. We realized that for many people, mapping was technically difficult and expensive. Typically, you had to buy expensive, complex software and follow a long training course before you could even begin making simple maps. This made mapping inaccessible for many people who wanted make and use maps in reports, stories, and presentations to explain environmental issues.
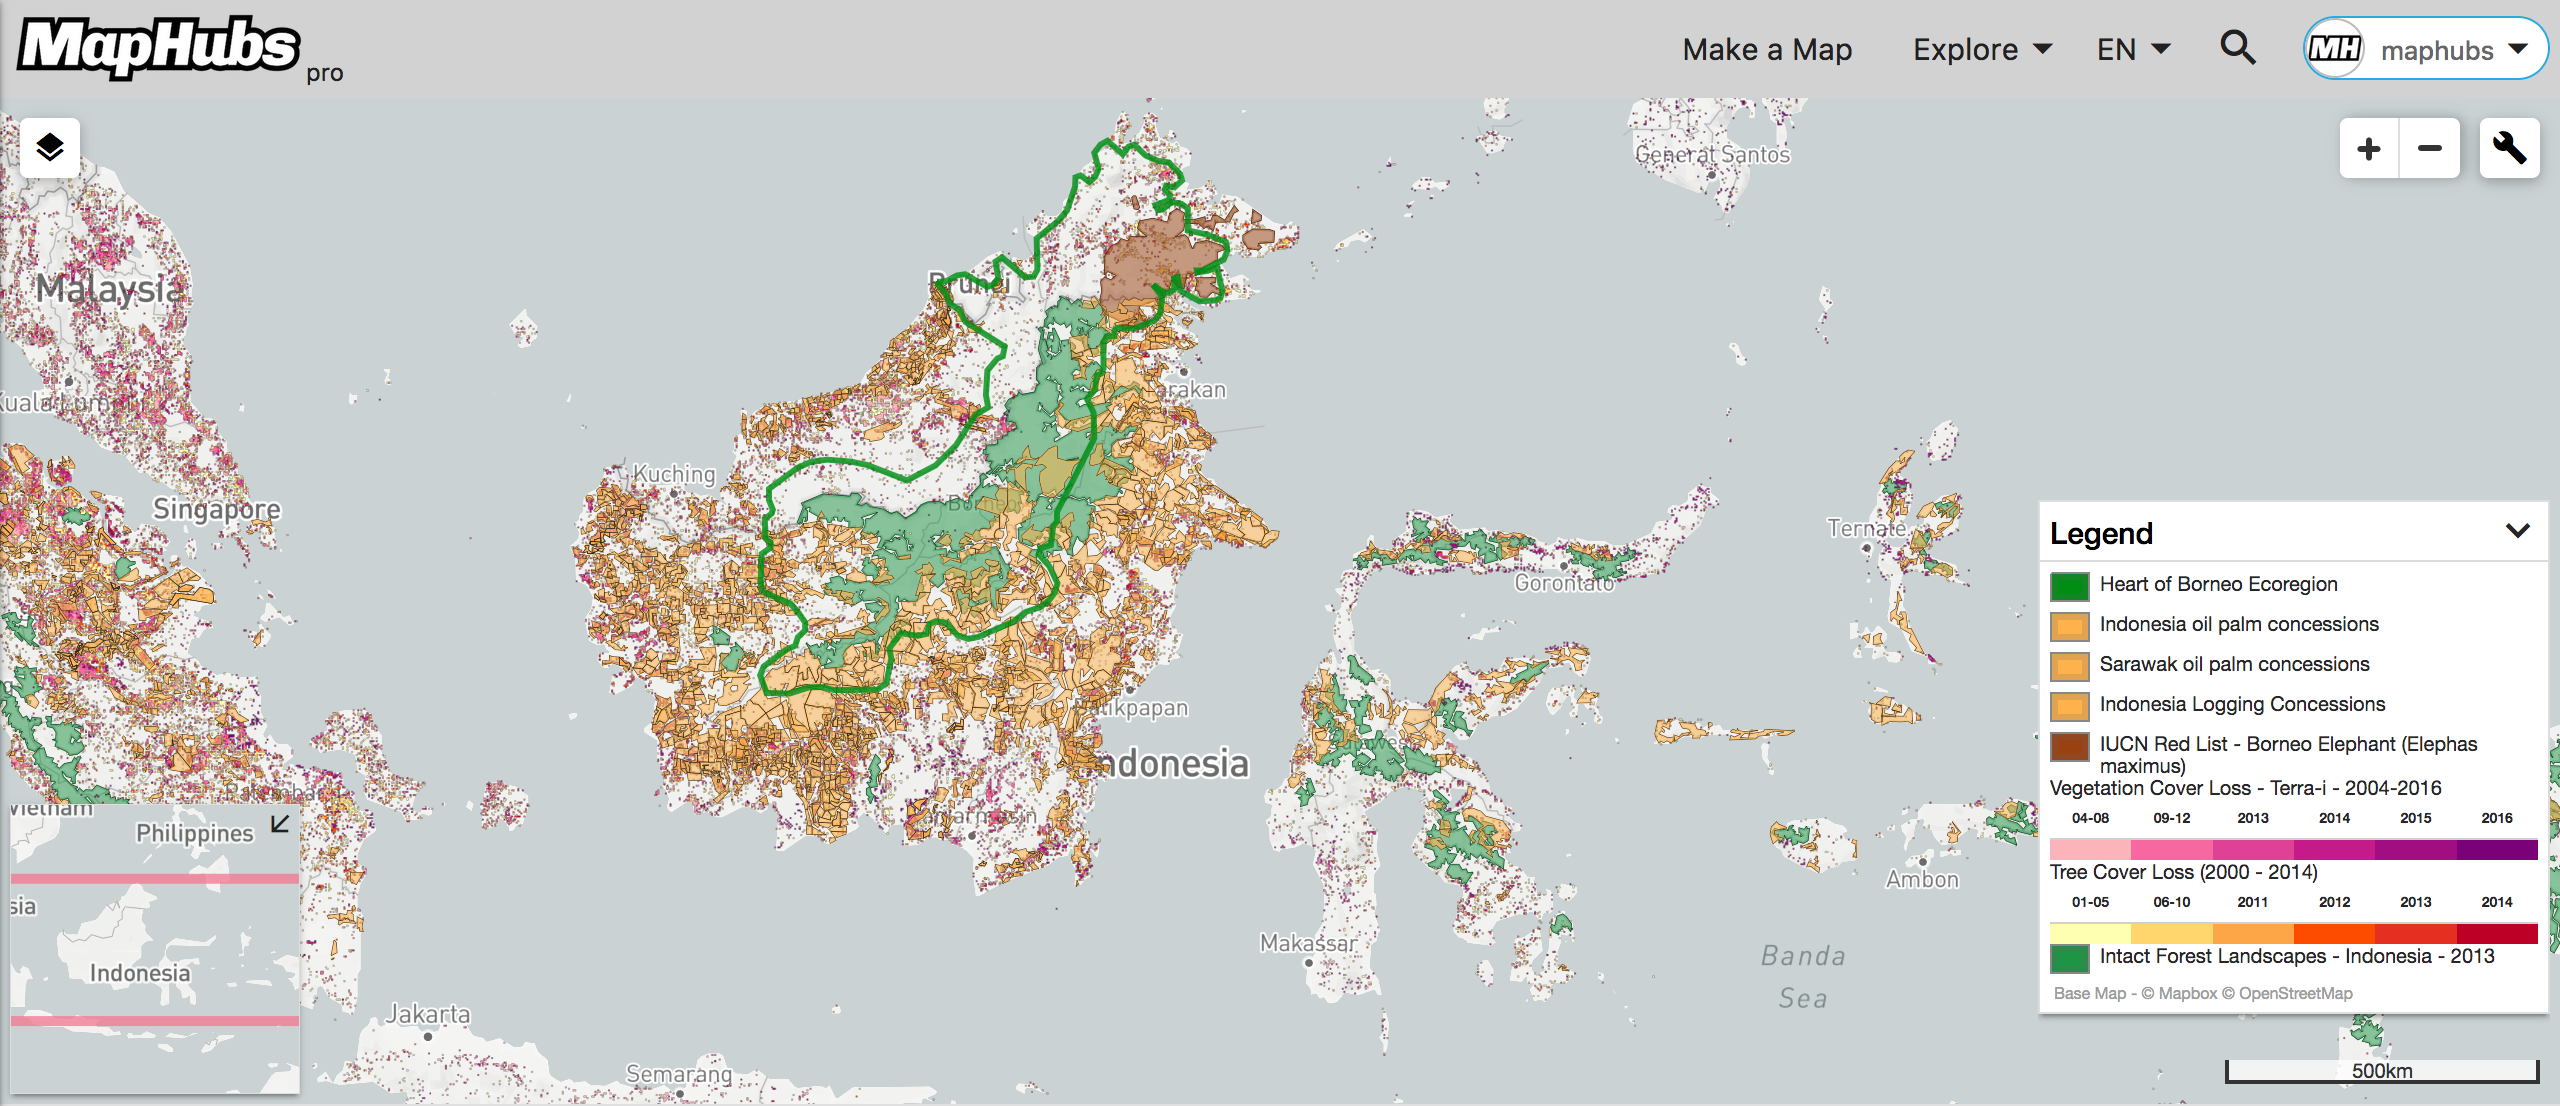
The other major problem was data accessibility… you often had to visit many different sites to find map data. To understand complex environmental issues such as deforestation in Indonesia, you would need to collect data from different sources, [such as] zoning data from governments, satellite information from NASA or a commercial provider, company information data such as mining permits, and community data such as customary property rights often collected by indigenous rights organizations.
[T]here really wasn’t a cross-cutting platform that covered the entire spectrum of environmental topics and geographies and was completely free to use.
MB-WT: How does Map for Environment compare to ArcGIS Online or other free GIS platforms, such as QGIS?
M4E aims to be a truly open repository for environmental data with simple data management and map publishing tools for both non-technical and experienced users.
ArcGIS is really geared for GIS specialists and offers a host of analytical tools and map publishing, which is a little overwhelming for someone with no GIS experience. QGIS is a great open-source alternative to ArcGIS but is only desktop-based and, again, focused more towards technical GIS users who want to perform complex analytics and build sophisticated geospatial visualizations.
With MapHubs [the software behind M4E], we can train users with no GIS experience in two days how to use our entire platform – data management, data creation, map/hub/story publishing, and forest monitoring. This allows everyone within an organization to make maps rather than relying on a GIS specialist. It’s not our intention to compete head-to-head with ESRI or other GIS platforms but rather offer a simple service for finding the data and a few essential analytical tools.
We do have some analytical tools such as a forest alert system using University of Maryland’s GLAD alerts and a measurement tool so you can measure the size of mapping objects. We will also add more analytical tools but would rather build only the tools where a critical mass of our users demand them.
MB-WT: What areas are being mapped by M4E?
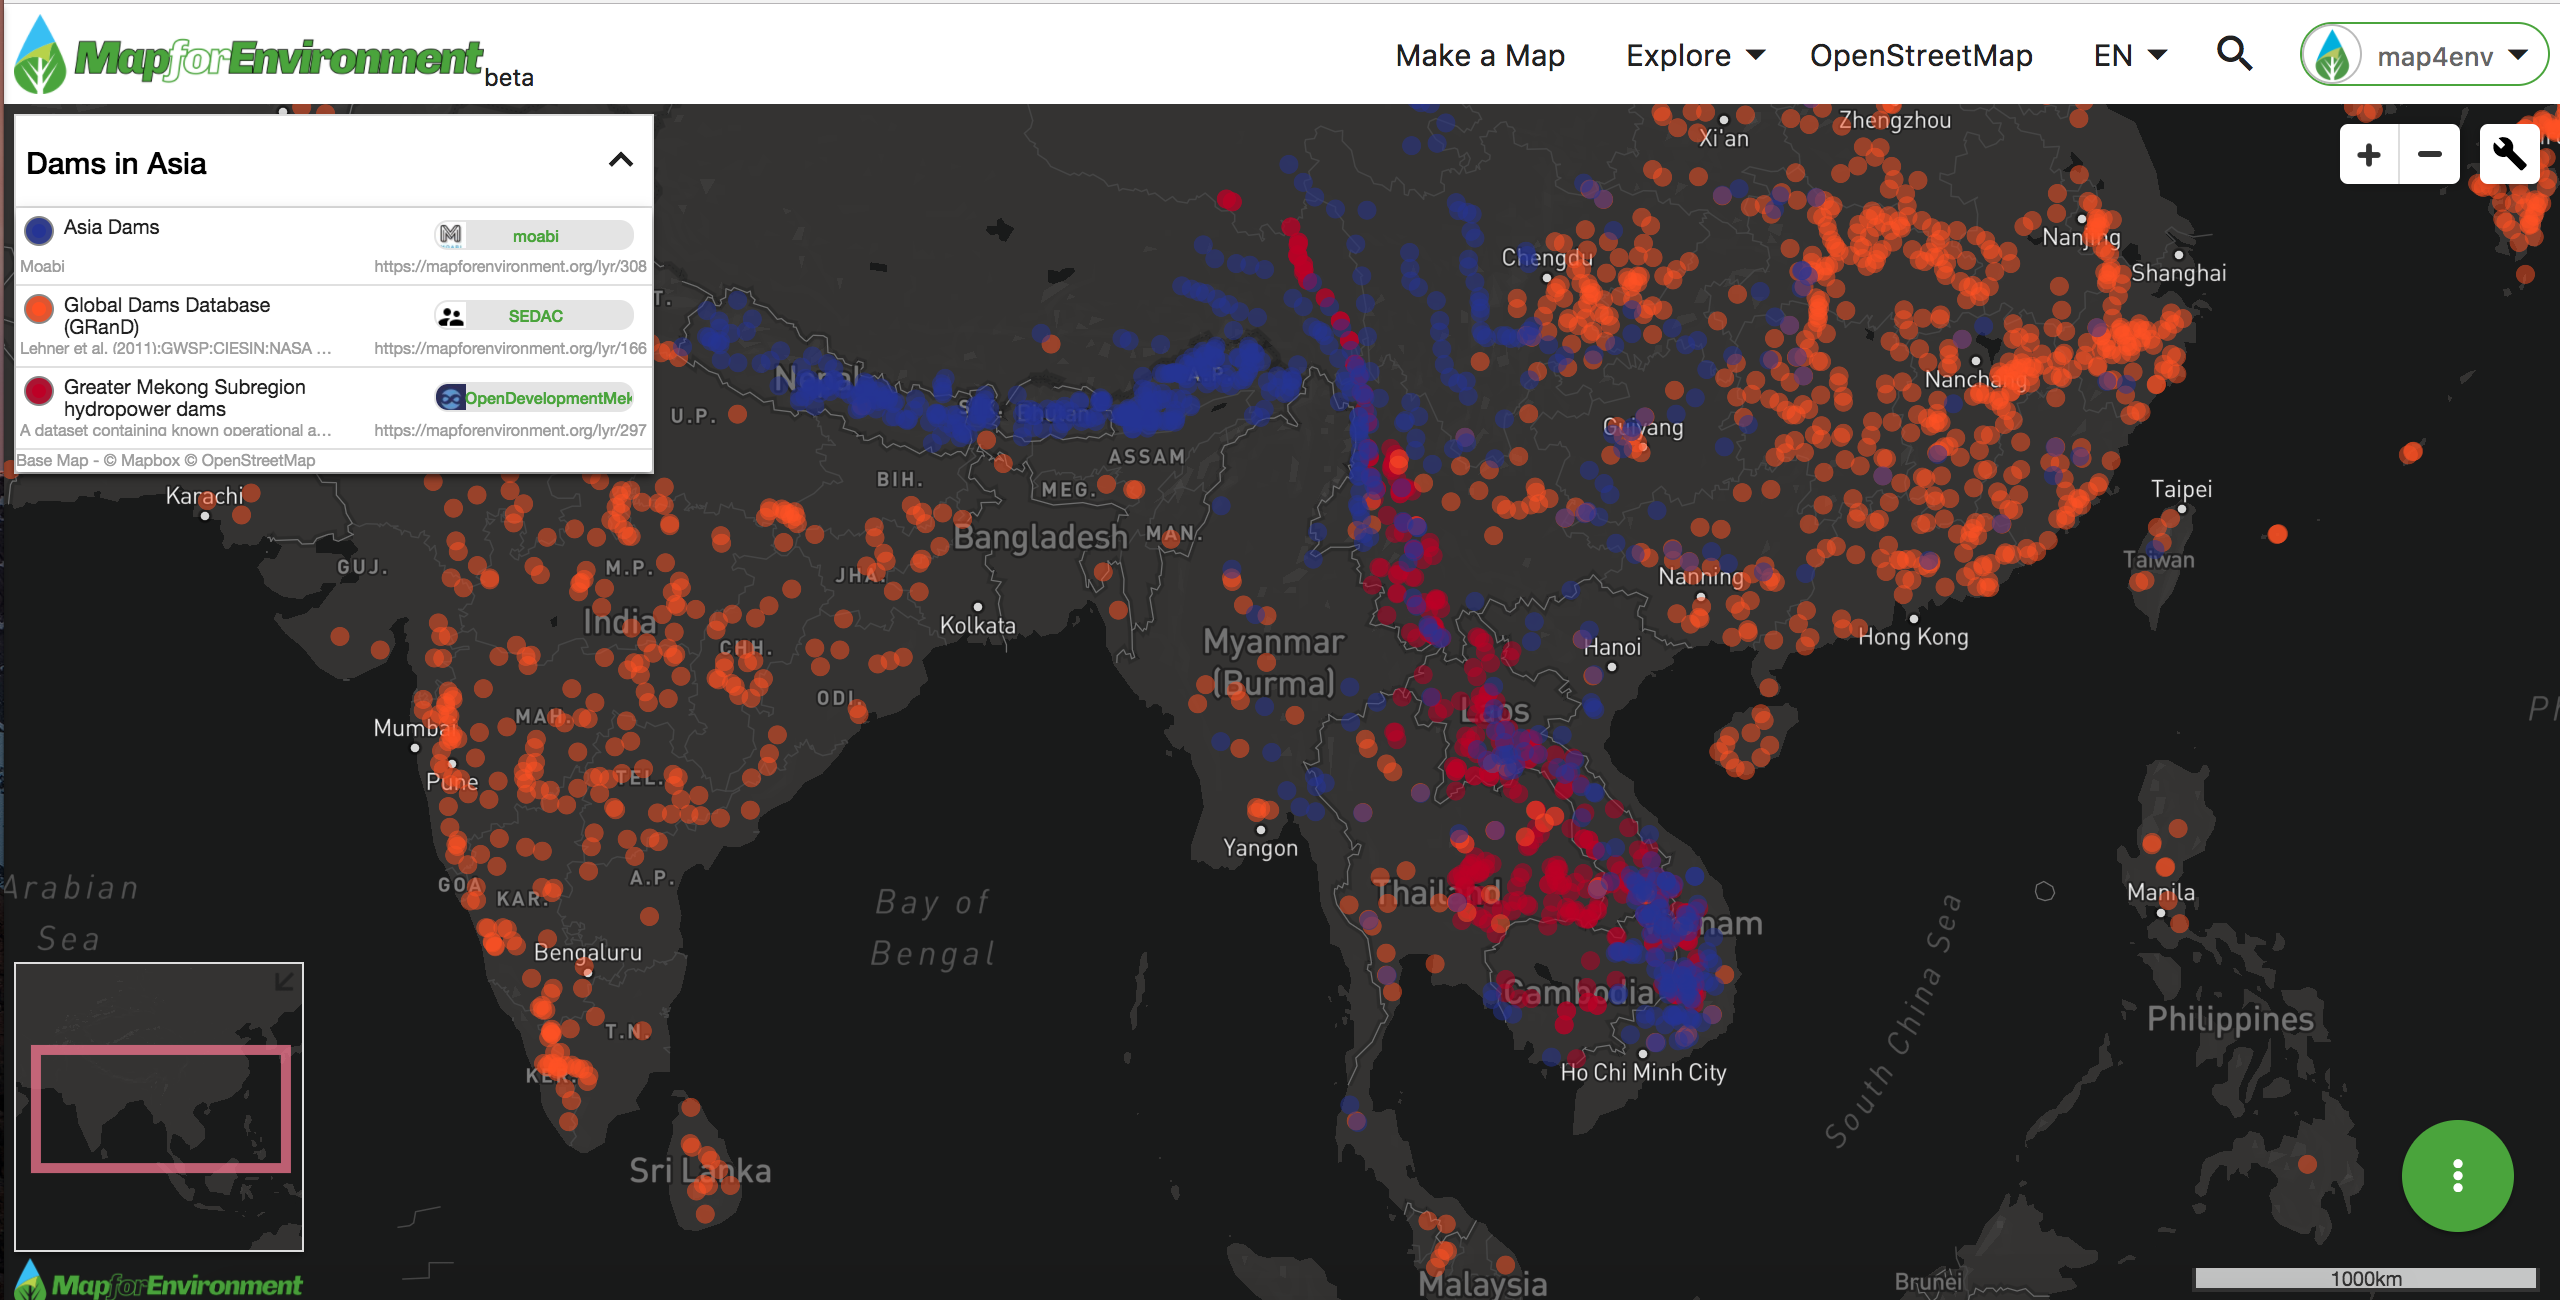
M4E is already being used to monitor industrial agriculture in Indonesia and the Congo Basin, including oil palm plantations and transport routes. In partnership with Global Forest Watch and European Commission Joint Research Centre, we are mapping logging roads in Congo Basin, Peru, and Indonesia. Using OpenStreetMap, we are also mapping planned dam impacts in the Mekong, and fracking drill pads and access roads in North Dakota. We also highlight new research findings. This past month, we overlaid a map of extensive peatlands in the Congo Basin, described by Professor Simon Lewis and colleagues in a recent paper in the journal Nature, with plantations and logging concessions to highlight potential climate change risks if this area is drained.

MB-WT: How do you obtain the spatial data on the site? What are the main obstacles to broadening the map collection and extent?
To compile these data, the platform makes use of a variety of existing open-data portals, including Global Forest Watch [which allows users to monitor forest change over time], and OpenStreetMap [which crowd-sources spatial data globally]. For example, if you are interested in international forest issues, we host information from Global Forest Watch, but we supplement this with data from other sources, such as government agencies, advocacy NGOs, and research organizations, and attribute information to the organization that provided the data. And in M4E, you can add your own data and make your own maps.
Some organizations, such as palm oil companies, share their data through M4E and manage their data directly. We are encouraging more organizations to open-source their data and not place onerous licensing restrictions on use. M4E gives users a range of data licensing options. If an organization approaches us around a topic, we will help them find the data. The information is then posted on the platform, so everyone can use it. There are plenty of gaps, but the more people contribute, the more the gaps can be filled in, and the more useful M4E becomes.
MB-WT: Do users uploading data have to make it publicly available? How does data security play a role in how users make and share maps?
Yes, by default all data uploaded to M4E is public and available for use and download according to the license selected by the user. If users would like to post data but prevent download, we can help with this on a case by case basis.
If users need privacy, MapHubs is available for installation in the cloud or if you have serious security concerns, on a local server inside your organizational firewall. This is called MapHubs Pro and can be both a private or public-facing mapping platform that gives you the tools of M4E but with the ability to control access to your own data. The Environmental Investigation Agency currently uses MapHubs Pro for mapping and privately sharing illegal logging and agriculture expansion. MapHubs Pro costs vary, depending on feature and data requirements, but it is more affordable than building a custom mapping website, which can cost from $30K to hundreds of thousands of dollars. We will also be releasing MapHubs Cloud Service in the coming months for those who just want to keep one or two layers private rather than a whole institutional data platform.
MB-WT: What are your other plans for the next year? Where do you see the platform headed?
For M4E, we have built a host of new features, such as the forest alerts, and have made it easy to embed satellite imagery, such as Planet scenes [for those with access to Planet imagery]. This year, we will keep refining the M4E’s tools as simplified map editor and increase our outreach efforts, so more people know about M4E and contribute data. We also plan to make data agreements with major organizations so users can have access to critical datasets directly from the source. This will include open imagery such as Sentinel and Landsat imagery, so you can monitor areas and create your data on deforestation and other observable land use changes.
We see M4E becoming a community-driven platform for the environmentally concerned citizen and organization. Our vision is a small, decentralized community providing the tools for both sharing data and making and disseminating maps with the minimal amount of cost and hassle. We simply provide the space and let people provide the content. For this to succeed, I think the environmental movement needs to embrace open-data principles and stop restricting access to data that has vital utility to many organizations.
Our immediate goal is to build a financial and institutional model that that allows this community to take hold and galvanize a critical mass of organizations to support transparency and data sharing.