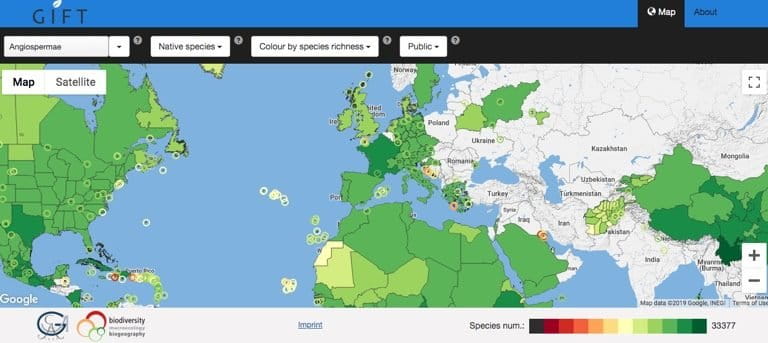
- The Global Inventory of Floras and Traits, or GIFT 1.0, is the first database of its kind, bringing together thousands of published and unpublished plant species checklists and inventories from around the world.
- It holds more than 3,800 species lists for nearly 2,900 regions around the world, covering about 79 percent of the global land surface and 80 percent (more than 315,000 species) of all plant species known to science, the researchers who created the database say.
- Mongabay spoke with Patrick Weigelt, co-developer of GIFT, about what went into creating the database, and what it can be used for.
For more than 200 years, naturalists, adventurers, explorers and plant hunters have navigated the Earth, documenting the planet’s rich, unique plant life in journal pages, books and herbaria. From hard copies, some of this information has started being digitized, moving to local or regional databases in recent years. Yet, answers about where the world’s known wild plant species are distributed haven’t been easily available — a new global database hopes to change that.
The Global Inventory of Floras and Traits, or GIFT 1.0, is the first of its kind, putting together thousands of published and unpublished checklists and inventories from around the world into a single database. It holds more than 3,800 species lists for nearly 2,900 regions around the world, including countries, protected areas, or islands, allowing people to extract information, such as where a species is distributed, whether a species is native to a region or not, or the list of plant species a region contains. These lists were mostly collated from regional checklists and Floras (publications containing scientific descriptions of plants).
Individual species are, in turn, linked to their functional traits, or characteristics that determine a species’ fitness or survival, like their height, leaf size, or rates of growth, researchers from the University of Göttingen, Germany, who created the database, report in a new study.
“GIFT allows researchers, for the first time, to analyse near complete patterns of global plant diversity and regional species composition along with past and present effects,” Holger Kreft, co-author of the paper and a professor at the University of Göttingen, said in a statement.
As of today, GIFT 1.0, the fruit of a decade-long effort, covers about 79 percent of the global land surface and 80 percent (more than 315,000 species) of all plant species known to science, the researchers say.
“In the light of the current biodiversity crisis and ongoing extinctions, it’s important to understand how things came about, to understand the processes behind the distribution patterns of plant diversity that we see. That is what GIFT contributes to,” Patrick Weigelt, lead author of the study and a senior scientist at the University of Göttingen, told Mongabay.
Mongabay spoke with Weigelt about GIFT, what went into creating the database, and what it can be used for.
Mongabay: How did the idea for a global inventory of floras and traits come about and how did you get involved?
Patrick Weigelt: It goes quite a way back. In the late 1990s, early 2000s, the head of our department and supervisor of my Ph.D., Holger Kreft, and his former working group in Bonn published about global diversity patterns of plants and developed a database of species richness estimates of plants globally. When I started my Ph.D. in his newly founded working group in Göttingen in 2010, we decided to take this approach one step further and establish a database of regional species inventories, that is, not only species numbers but all species identities per region. Back then, I was focusing on islands, trying to answer questions like why are there more species on certain islands than on others? How does remoteness of an island, or how far it is from the mainland, and other island characteristics affect colonization, speciation and extinction on islands? How many plant species are restricted to individual islands and why? During my Ph.D., I collected some 1,000 island flora checklists, and we built up the database infrastructure which now forms the basis of GIFT, and incorporated those island species checklists in there.
The next step was then to go beyond islands. We therefore started collecting species checklists for mainland regions, such as entire countries like India, Peru or Germany, or individual states of the U.S., or protected areas, to tackle research questions related to all facets of global plant diversity patterns.

How did you go about collecting the flora lists for this database?
There are different kinds of data that go into GIFT. Some are published hard copies of books: Floras and checklists that we digitalize together with a lot of helpers. Some are PDF checklists that we can download from publisher websites and get information from. There are different kinds of those checklists, some that are very tedious to work on, others that are machine readable, and easy to extract information from. And then we also use other smaller online databases that, for example, provide the Flora of Hawaii or the Flora of the West Indies.
Did you look at English-language checklists only?
Primarily English, yes. We are based in Germany, so if we get our hands on a German checklist, then of course, we also use that. Most modern publications are in English, so this is why I would say 98 percent of the information is in English. But then, now that it’s getting more and more difficult to get data for the few regions that have data gaps, we also go into primary literature that is published in other languages such as Spanish or Russian.
What does GIFT 1.0 contain?
GIFT 1.0 includes species checklists and the composition of plant species for various geographic regions like islands, countries, national parks, and so on. This is all linked to information about the geographic region they occur in. We have polygons defining the outline of the regions, and based on those, we can extract information such as how large a region is, what is the region’s climate, population density, and so on.
At the level of the individual species, we include information about their functional traits, such as the species’ growth form, height, leaf size and dispersal or pollination mode. We also place each species in the plant tree of life. Our data can be used to answer biogeographical and macroecological questions, like for example, what characteristics enable a species to colonize new regions, or what island characteristics drive whether there are a lot of alien species introduced or not.
Could you elaborate on any one of these use cases?
For example, together with colleagues from Kansas and the Global Naturalized Alien Flora project (GloNAF, www.glonaf.org) we recently published a study showing that mycorrhizal plant-fungi interactions act as a filter for island colonization and that their filtering effect is reduced by man introducing plants and their symbionts to remote islands.
What information does GIFT 1.0 not contain that you would want to include in the future?
I think in terms of different kinds of information, the database is already very comprehensive. We basically have all aspects in there that we envisioned. But now, we want to fill gaps. There are areas of the world where we don’t have good information. And our priority at the moment is to close those gaps in terms of geographic coverage and more reliable data. That would be Central Asia, Southeast Asia, and Africa. At the same time, we want to integrate our database more closely with other biodiversity databases like GBIF (Global Biodiversity Information Facility), sPlot or TRY plant trait database.
Which parts of the world do you have good coverage for?
Generally, for plant distribution data, there’s good information for the temperate zones. North America, Australia, Europe have a long history of botanical exploration and thus are well covered. There’s also good data from tropical South America, where there has been a lot of research. Even though we know that not 100 percent of all species are included, we still have a good idea of the species composition of those regions.
The closer you come to the tropics, the more difficult it gets, just because there are so many more species. Gaps in tropical Africa and tropical Asia are the ones we need to work on. There can be two reasons why we don’t have data for these regions: one is that due to limited time we could not include all datasets that are available. But the second reason can also be that the information is simply not there yet.
How do you plan to address the gap in geographic coverage?
Parts of the gaps will be filled by including data that we have been preparing for importing them into GIFT during the last couple of months. However, certain gaps will remain and we want to address more quantitatively where those gaps are located and how complete the floras we have are. This is something that we would like to address with a Ph.D. student, somebody who can work on this for three years, looking into developing tools that help us estimate how complete the plant inventories are.
Can researchers from countries where there are gaps contribute data in any way?
Yes, they can definitely hint us toward published or unpublished checklists, because we don’t find everything. Or if they know of somebody who is doing a regional plant inventory project somewhere or somebody who’s digitalized old printed Floras or checklists because they needed this information for a local project, then this is data that would be very useful for us.
But we have to keep in mind that GIFT focuses on regional plant species inventories and checklists. Individual plant observations, for example, would be better to report to citizen scientist platforms like iNaturalist, where people can report where they found what species. This is very valuable information for science, but different from the kind of information that we focus on.
What about groups of plants? What groups are well represented in GIFT and which ones are not?
Most of our data are for vascular plants [plants that have specialized tissues, xylem and phloem, to transport food and water to different parts]. These include the ferns and relatives, gymnosperms and flowering plants. In terms of coverage across the plant phylogeny of vascular plants, our database is quite well balanced. So we cannot say we have more information for one group than another. We focus on native plants, though. There is considerably fewer information for introduced plants, a group of species that we work on together with colleagues in the Global Naturalized Alien Flora initiative.
What were some challenges of bringing all these species lists from different sources together into one database?
First of all, information comes in very different formats, so we had to develop a scheme to standardize the data. This can be very tedious and challenging for hundreds of thousands of species. We had to standardize across all resources, from hard copy information to digitally available ones; extract functional trait data from the texts, which is not always just a copy-paste job from nicely formatted tables. These are usually descriptions that we have to read in detail in order to get the information out of them. It’s all doable, but it takes a lot of work and time.
How is GIFT different from other large plant distribution databases out there like GBIF?
We focus on a type of information that currently is not well represented in global data base efforts. GBIF, for example, is mainly a database of point occurrences or specimen data. You have a species, and you’ll get information about when and where it was collected. This is very valuable. Our data is aggregated at a different spatial scale. We don’t focus on point occurrence information. Instead, we have the floristic composition or species composition for entire regions. And this can be used to answer different questions because of its coarser spatial resolution. While we don’t know where exactly the species occur, and that’s a disadvantage, the advantage is that we can more easily gain large geographic coverage and higher regional completeness.
Both datasets can be used in combination. You can, for example, use the high-resolution data from GBIF to see where exactly a species occurs. Then you can use our dataset to validate that species occurrence. Let’s say a Neotropical species from South America is seen occurring in Germany, maybe because it got the wrong coordinates assigned to it — the coordinates could be of a herbarium where the specimen was stored. Based on our checklist, we can say that the species occurrence on GBIF is probably a false occurrence. We can also say whether an occurrence is likely native — whether it should naturally occur there, or whether it is a species introduction, because it falls into the range where the species has been introduced, but where it shouldn’t occur naturally. In addition, GIFT can be used to assess how complete information from other distribution or trait databases is for a certain study region.
If people want to learn more or contribute, what’s the best way to get in touch?
People can contact us on gift@uni-goettingen.de.

Citation:
Weigelt, P., König, C., & Kreft, H. (2019). GIFT — A Global Inventory of Floras and Traits for macroecology and biogeography. Journal of Biogeography. doi:10.1111/jbi.13623