- Records from 650 of the largest glaciers in the Himalayan range show that rate of ice loss from 2000 to 2016 is double that from the period 1975 to 2000.
- The annual glacial melt has accelerated from an average 10 inches (25 centimeters) to 20 inches (50 centimeters) and has been linked to rising average temperatures.
- The researchers constructed a 40-year record with 3D modeling, using declassified Cold War-era spy satellite images and more recent satellite photos.
- An estimated 800 million people depend on runoff from the Himalayan glaciers for irrigation, hydropower and drinking water, and could be impacted as the glacial melting accelerates and then tapers off.
Himalayan glaciers, considered the “third pole” of the world because of the sheer volume of ice they hold, melted twice as quickly between 2000 and 2016 compared to 1975 and 2000, a new study shows.
Rising temperatures are the driving force behind the accelerating glacial melt, according to the study published June 19 in the journal Science Advances.
“Ice loss in the Himalayas has accelerated over the past four decades, and that the rates of ice loss we observe agree with the amount of atmospheric warming which has occurred,” Joshua Maurer, a glacier researcher at the Lamont-Doherty Earth Observatory at Columbia University in New York, told Mongabay over email.
The researchers relied on 40 years of satellite data from India, China, Nepal and Bhutan to understand how the glaciers transformed over time, including satellite imagery from a Cold War-era U.S. spy mission, which involved parachuting photo film over the Pacific Ocean to be captured by fighter jets mid-air. Information from that mission is helping scientists understand a new threat better: melting glaciers.
The rapid melting of Himalayan glaciers, estimated to hold 600 billion tonnes of ice and which feed major perennial river systems in the region, is already leading to more frequent and severe floods downstream. An estimated 800 million people depend on runoff from the glaciers for irrigation, hydropower and drinking water. The pattern of ice loss also poses the threat of water shortages within decades.
Between 2000 and 2016, the average temperature in the region was 1 degree Celsius (1.8 degrees Fahrenheit) higher than it was from 1975 to 2000, leading the scientists to conclude that warming was to blame for most of the observed changes.
The researchers used the satellite imagery to home in on 650 of the largest glaciers in the region and develop 3D models to capture the changes in their elevation. In recent years, they found, the glaciers have been discharging about 8 billion tons of water annually — an amount of water that would fill 3.2 million Olympic-sized swimming pools.
To develop those 3D models, the researchers needed at least two overlapping photos of the same glacier. That’s where the U.S. surveillance program came in handy.
From 1971 to 1986 the U.S. ran a satellite program codenamed HEXAGON, launching 20 reconnaissance satellites with telescopic cameras on board. The photographic reels from the cameras were parachuted in buckets back to Earth and intercepted in mid-air over the Pacific Ocean by U.S. Air Force jets.
The mission was declassified in 2011, and with about 55 to 70 percent overlap in the images captured, the HEXAGON photographs proved invaluable in putting together a long-term trajectory of ice loss.
For 2000 onward, the researchers accessed optical imagery data from advanced satellites that could record elevation changes better. “The spy satellite images provide a longer timespan of observation, which allows us to get a more robust estimate of the long-term trend of glacier change,” Maurer said.
From their reconstructions, they estimate that in the 25-year period from 1975 to 2000, the 650 glaciers lost an average of about 10 inches (25 centimeters) of ice annually; but from 2000 to 2016 they shed about 20 inches (50 centimeters) on average every year. The warming intensified in the 1990s; however, glaciers respond slowly to the changing climate.
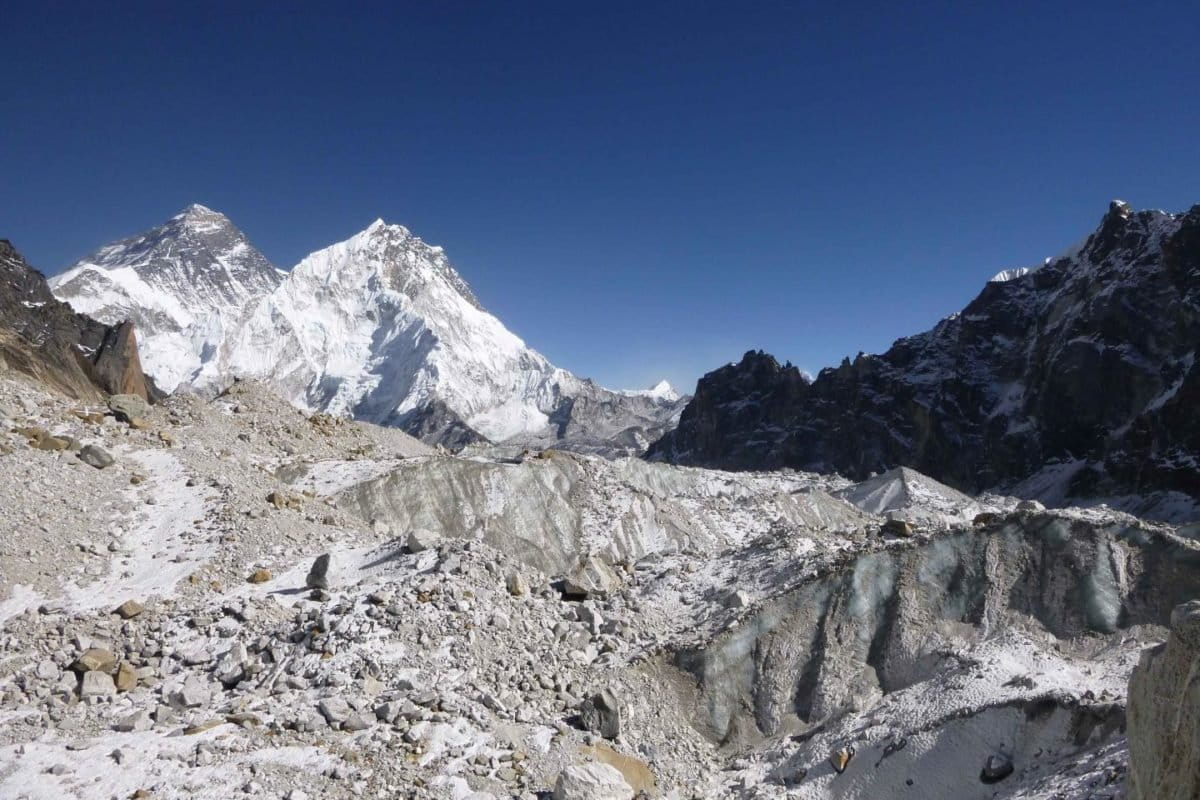
Banner image of the Changri Nup glacier, one of hundreds studied by the researchers, with the peak of Mount Everest visible in the background on the left, courtesy of Joshua Maurer.
Citation:
Maurer, J. M., Schaefer, J. M., Rupper, S., & Corley, A. (2019). Acceleration of ice loss across the Himalayas over the past 40 years. Science Advances,5(6). doi:10.1126/sciadv.aav7266
Malavika Vyawahare is the Madagascar staff writer for Mongabay. Find her on Twitter: @MalavikaVy
FEEDBACK: Use this form to send a message to the author of this post. If you want to post a public comment, you can do that at the bottom of the page.