- Technology now allows us to remotely locate and monitor areas of forest loss, creating the challenge of responding to areas with rampant deforestation.
- The Global Forest Watch platform has launched Places to Watch, a feature that highlights key areas of recent deforestation, especially near intact and protected forests.
- An automated process selects deforestation hotspots, which are then filtered and prioritized by experts using satellite imagery and locally-derived reports to select 10 “Places” each month.
- The GFW team aims to provide journalists, activists, and concerned citizens and government, with curated deforestation information to encourage action that prevents further loss in priority areas.
Where deforestation is widespread, sometimes it’s hard to see the (loss of) forest for the (loss of) trees.
Global Forest Watch’s online forest change monitoring platform has added a new feature, called Places to Watch, that highlights key areas of concentrated recent deforestation to encourage action that prevents further loss.
Places to Watch (PtW) builds on the weekly-updated GLAD deforestation alerts, accessed in Global Forest Watch (GFW). The system notifies subscribers when fine-scale (30-meter resolution) forest loss occurs in their target areas and enables them to see the areas of loss on a map. Subscribers that use GLAD alerts to monitor a region or country where forest loss is rampant can thus be overwhelmed by the number of alerts.

The PtW initiative aims to filter, prioritize, and interpret the deforestation data identified by the alerts. It displays the results as short stories that readers can investigate further and push governments and other relevant parties to respond.
The GFW team expects this feature to particularly benefit journalists and international advocacy groups, who are interested in the information presented by GLAD alerts but lack the time to dig through all the data to find an interesting place to cover.
The success of deforestation reports by the Monitoring of the Andean Amazon Project (MAAP) in capturing the attention of Peru’s policy makers and public served as a model. MAAP’s plain-language, map-based reports use information from GFW and GLAD alerts; PtW has broadened and automated this process.
“Places to Watch is a great tool to take the basic concept of MAAP, which is identify, prioritize, understand, and hopefully address the most important of the thousands of raw, near real-time forest loss alerts, to a global level,” said MAAP director Matt Finer.

Step 1: Automated Analysis
PtW selection is a two-step process. To facilitate updating these Places each month, the GFW team has automated the first part of the process, using algorithms that combine the density of forest loss alerts with the presence of intact and protected forests.
The procedure divides forested areas where GLAD alerts are available into grid cells of 10 km x 10 km (10,000 hectares, or 25,000 acres). Within each grid cell, the algorithms first count the number of alerts (each alert represents a forested 30 m x 30 m pixel that loses half its forest cover).
They also calculate a “Concern Score”—an index of the percentage of each grid cell that occurs within protected areas (PAs) and within Intact Forest Landscapes (IFLs). The model weights strictly protected areas (IUCN categories I-II) higher than less strictly protected areas.


The automated selection multiplies the number of alerts in each grid cell by its Concern Score to give each cell its total score for the month.
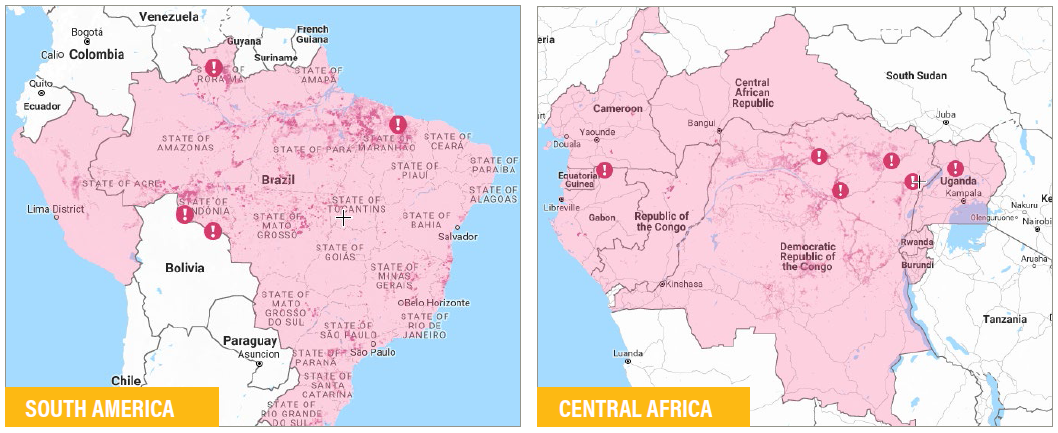
This automated first cut identifies and ranks the top 10 Places to Watch—each a single 10 km x 10 km grid cell— in South America, Central Africa, and Southeast Asia.
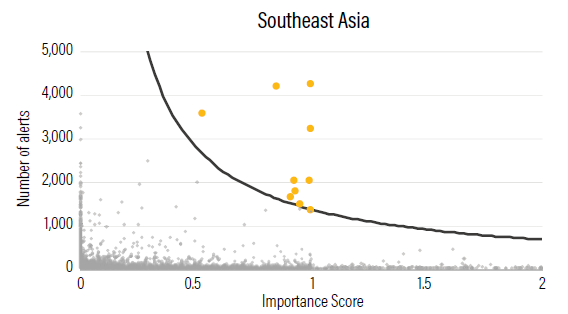
The level of loss that triggers a grid cell to be considered as a PtW for a given month will vary each month and in each of the three regions. The total score is relative—if there is substantial forest loss in Southeast Asia in a given month, the 10 PtW there may have experienced greater loss than those selected in a month of lower overall forest loss or in Central Africa that same month.
The model includes all alerts in the 10-km grid cell, even if some alerts in the cell fall outside protected or intact forest. The PtW technical note acknowledges that “…the use of 10-kilometer grid cells as the unit of analysis results in arbitrary squares rather than areas defined by their significance to conservation. The use of grid cells introduces opportunities to miss important clearing, such as if a large patch of alerts spans more than one grid cell, or if a cell does not meet the Concern Score threshold because only part of it falls on land.”
The aim of the PtW feature is to encourage concern and action regarding the area of interest, using the 10-km cells as a basis for the conversation. “However,” GFW Research Analyst Mikaela Weisse told Mongabay-Wildtech, “when we write the stories, we often end up talking about what’s happening throughout that protected area or region rather than focusing solely on the 10 x 10 km grid cell.”

Issues with selection criteria
The team also acknowledges the limitations of using global-scale data, such as using intact and protected forests to represent all biodiversity. Both criteria have global, up-to-date data available, but they are relatively coarse-scale and exclude areas that are unprotected or don’t meet IFL size criteria, which are geared toward wide-ranging animal species.
“We are aware that our “Concern Score” is not a perfect measure and doesn’t address areas that are not intact or not protected but are still important to biodiversity or other factors,” said Weisse. “We chose to use protected areas, and particularly strictly protected areas, to better identify where human activity really shouldn’t be happening.”
The GFW team will wait to hear the critical reaction to the new product before making changes to the model. They hope to add additional layers, such as areas supporting intact biological communities or rare and range-restricted species, that could identify high-biodiversity areas outside protected areas.
“We’re also waiting on a new map of primary forests for the tropics which could help broaden our algorithm to include natural, undisturbed forests, but with less restrictions than the Intact Forest Landscapes layer,” added Weisse.
They also hope eventually to tailor the selection process to individual countries so they can include pertinent national-scale data, such as peat soils in Indonesia or country-specific reserve definitions.
Step 2: Expert assessment: curating and selecting 10 “interesting” places to watch globally
The GFW team then narrows each month’s list to the “10 most interesting” PtW, those where action may be needed more urgently to slow illegal deforestation.
“We bring our team together to review the 30 [computer-generated] Places to Watch and select the areas to feature based on evaluation of satellite imagery, contextual information, and our own expert knowledge,’ said Weisse. “Generally we look for areas where (a) the drivers are clear, (b) the expansion of forest change is relatively recent, (c) the activities appear to be large scale, and/or (d) we have reason to believe the changes happening may not be legal.”
The team contacts an “action network”—currently GFW partners working in or knowledgeable of the proposed PtW—who can provide more detailed information about what’s happening on the ground and the actors involved.
“This of course includes drivers, but may also include more information about the land ownership and history of this area, as well as pictures from the ground,” said Weisse. “If there are specific actions or recommendations that our Action Network deems important for readers, we’ll also include these calls to action.”
Step 3: Translating data into action
The GFW team summarizes all the information and sends the annotated list to subscribers, which they expect will comprise journalists, activists, and others interested in forest change. GFW identified the first group of five PtW in December 2017.
The team also plans to track several types of outcomes in areas designated Places to Watch.
“We can most directly track the engagement and attention that these places get—” said Weisse, “for example, tracking the media around each place, or whether people are paying more attention to these particular places on the Global Forest Watch map.”
“Of more interest but more difficult to track is the actual impact on forest change,” she added. The GFW team expects to track future forest loss both through GFW and follow-up with action network colleagues.
You can sign up to receive the top 10 Places to Watch each month in your email. You can also view the latest PtW on the GFW blog and the GFW map.

Reference
Weisse, M.J., R. Petersen, S. Sargent, S. Gibbes. 2017. “Places to Watch: Identifying High-Priority Forest Disturbance from Near–Real Time Satellite Data.” Technical Note. Washington, DC: World Resources Institute. Available online at www.wri.org/publication/places-to-watch