- Collect Earth is a free, open-source tool built on Google Earth that enables non-experts to assess deforestation and other land cover change through point sampling.
- The program combines spatial data with visual photo interpretation of a set of sample areas of high spatial and temporal resolution satellite imagery, generating statistics for a target area.
- The platform assembles thousands of high-resolution images in one place, enables the user to view and analyze current and historic land cover dynamics, produce graphic and tabular results, and share them with colleagues.
- A recent study that used Collect Earth to map the world’s dry forests demonstrates how the point sampling approach is suited to large-scale assessments.
A recent study mapped the world’s dry forests using a relatively new tool that combines creative satellite image analysis with local- and national-scale knowledge.
Natural resource agencies worldwide inventory their country’s vegetation cover, land uses, and forest carbon stocks in order to quantify the extent and impacts of land use change as well as their progress toward commitments to international treaties. However, they often lack the tools to compile and analyze the necessary data on land use change.
New online platforms now enable viewing and analysis of global-scale imagery but cannot suggest the drivers of land cover change. Commercially available high-resolution remote sensing data are expensive, inconsistent in availability, and hard to access for non-experts.
Image data collection for non-experts
The drylands researchers, led by Jean-François Bastin of the United Nations Food and Agriculture Organization (FAO), used Collect Earth, a free, open-source platform that facilitates access to multiple freely available archives of satellite imagery. It is a plug-in for Google Earth that enables visual photo interpretation of very high spatial and temporal resolution satellite imagery, made available through three repositories: Google Earth, Google Earth Engine, and Bing Maps. This effort also partners with NASA, USGS, USFS, WRI.
Google Earth Engine (GEE) allows users to analyze satellite imagery in the cloud. Collect Earth offers users free access to both the high-resolution GEE images, as well as the very high-resolution (VHR, less than 1 m resolution) images of Google Earth and Bing maps. It brings together imagery from various sources stored in these three repositories for a range of time periods and from 30 cm to 30 m spatial resolution.
Collect Earth also introduces a unique method for monitoring land use and land cover that enables non-experts to derive information from these images through “augmented visual interpretation.” The platform integrates a Google Earth interface with an online data entry form that can be customized to fit the questions being asked for a particular project.
“Collect Earth allows the user to have a more refined understanding on the land without the need of powerful personal computers, explained co-author Marcelo Rezende, Land Monitoring Specialist at the FAO, in an email to Mongabay-Wildtech. “The user collects the data from visual interpretation of the very high-resolution imagery, together with historical information coming from Google Earth Engine.”
Point sampling meets image analysis
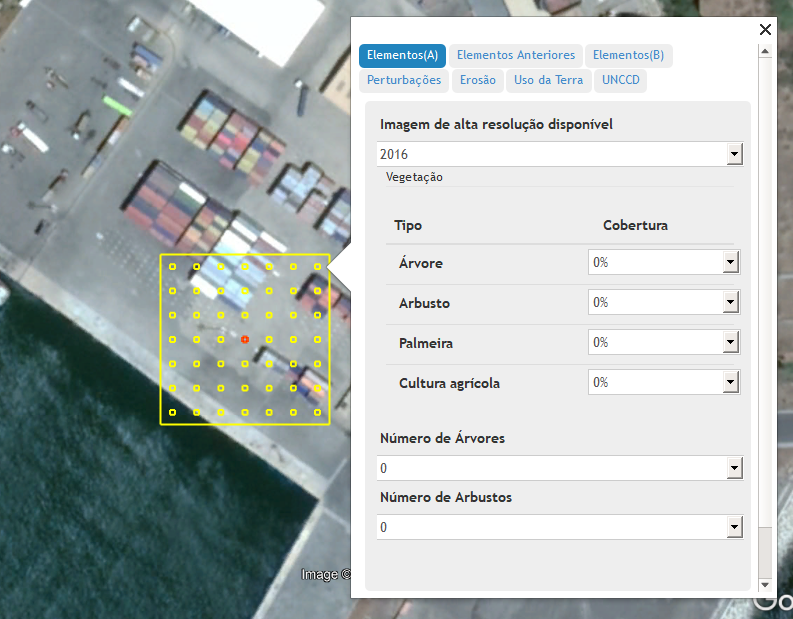
Collecting Data: A project team using Collect Earth assembles data on land cover by sampling many points across a target landscape. The team creates a sampling grid to overlay on the imagery available for the target area. Collect Earth offers a default 5 km x 5 km grid for download, but the grid squares, called plots, can be any size.

The team also creates a customizable survey data collection form. Using some portion of the plots, they “collect” data for each plot, one at a time, by visually inspecting both current and historical VHR images for that area. These data help document the current status and history of the selected plot.
For instance, explained Rezende in a recent presentation on Collect Earth, “If human impact in the plot is apparent, [users would] indicate the type…and the first year the human impact became apparent within the historical satellite imagery of plot.”
Using the data forms, users enter values from the imagery for the percentage of different land cover types (forest, agriculture, pasture, water)—for multiple time periods and for each plot. The specific questions and menus asked for each plot depend on the project.
“Each plot contains what we call control dots (inside the plot), which represent a percentage of the plot,” explained Rezende. “The operator uses them to assess the plot. The final classification is assigned to the center point.”
“There is a concrete methodology to assess the plots in order to minimize the subjectivities of the assessment,” he added. “In addition, every project contains duplicated plots (around 5% of the total) to allow a comparison between the assessment of different operators (measurement error). The sampling error is also accounted for [in] the attributes collected.”
The remote sensing community still lacks algorithms that can automate vegetation classification of high-resolution imagery, as exist for “medium” Landsat 30m resolution images, said Rezende, so data at that fine scale must still be entered manually. On the other hand, if users see something of interest in the imagery, they can add it to the data they are collecting.
Users can add official national statistics, regional land use and land management, plot-level surveys, sampling, and other data to the database. Collect Earth integrates QGIS, a free and open-source geographic information system, to enable users to process and analyze data in spatial format and convert them to a KML file compatible with Google Earth. The QGIS component would, for example, allow a user to integrate survey point data, vegetation types, elevation, roads, or political boundaries with the land cover information from the satellite images.
Analyzing data: Once the information for a plot has been entered, the program stores it for review and analysis. Users can click on a completed plot to see three groups of data about it. One small pop-up window shows the programming code editor and analysis results displayed as a set of graphs of green vegetation (NDVI), forest cover, and other vegetation information over time. A second window connects to Google Earth Engine, where users can browse various resources , and third a window connects to Bing or other high-resolution images.

The key to the program, though, is its ability to generates statistics based on the imagery and the data form for each plot. Each plot also serves as a data point to generate statistics on the target area as a whole. In his recent presentation, Rezende explained that the program is a sampling tool, not a mapping tool. It generates statistics, mainly for land use and land use change, for the area and time period of interest from the image-derived data entered by the user.
“The outputs of Collect Earth are point-based information for each plot assessed and overall statistics for the area of interest,” Rezende noted. “The type of attributes collected (forest change, crop cycles, infrastructure cover, etc) depends on the needs of the user, [who can] customize Collect Earth for a specific project.”
Data gathered through Collect Earth is exportable to various commonly used formats (CSV, XLS, PDF, JPG, PNG), as well as to Saiku, a drag-and-drop interface tool for data analysis.
An innovative image analysis approach to forest monitoring
The FAO developed the platform to enable countries to work independently to assess, quantify, and monitor their land cover and land use changes over time and to build capacity to conduct national forest inventories and monitor carbon stocks and forest cover to comply with REDD+ requirements.

Other possible uses for the high-resolution and VHR image analysis include identifying degraded land areas and landscape restoration opportunities, updating existing vegetation maps, and collecting spatially explicit socio-economic data.
Bastin and colleagues used Collect Earth’s high-resolution images and sampling approach to produce a recent global estimate of forest extent in drylands, calculated from high-resolution satellite images covering more than 200,000 plots. In their paper, they state, “To interpret the VHR images over such a large number of plots, we divided the world’s dryland domain into 12 regions and used a participatory approach. Scientists and students in 15 organizations around the world were trained to use a dedicated interpretation tool called Collect Earth with a common framework to assess the sample plots in which they had expertise.”
The data collectors used Collect Earth to record more than 70 parameters for each of these plots, from vegetation type and land-use to detailed counting of individual trees and shrubs, and identified more than 400 million hectares of previously unreported dry forest.
Collaboration and challenges
Users can upload their own images to Collect Earth, as well as share data and results with others. All data entered are stored in the platform’s database, which can be configured for individual users or for teams that collaborate regularly and need to see updates made by colleagues in real time.
The huge image files are not downloaded, however, so a user must be online to use Collect Earth. Google Earth loads the imagery from the cloud for each plot as additional data are entered. In a 2015 presentation, Rezende mentioned the additional challenges of long processing times when dealing with large volumes of data, as well as the reliance on Google Earth and other base sources of imagery over the long term. The software is meant to be user-friendly, but satellite image analysis is not trivial, and some data entry specifications may not be intuitive to users without prior knowledge of GIS and spatial data terminology.
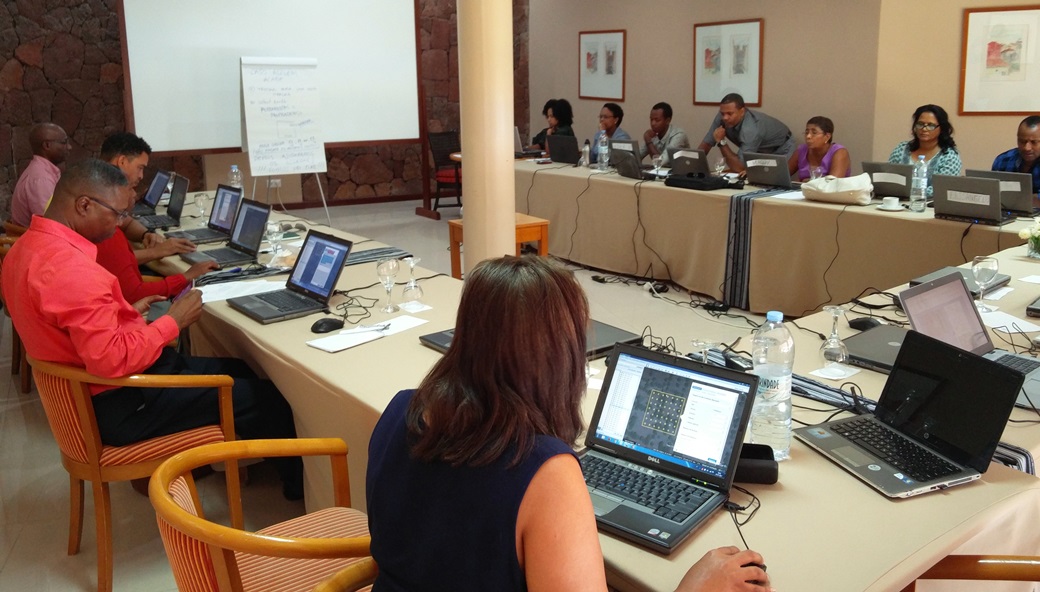
Collect Earth teams have trained more than 2,000 people in over 40 countries to use the platform. Most of these are government and university staff, which reflects the point sampling approach that may be best suited to large-scale assessments and building capacity to conduct national forest inventories and report on progress toward REDD+ and climate change reduction (UNFCCC) commitments.
Despite the highly sophisticated technology behind the data and image integration, “Collect Earth has a bottom-up approach,” said Rezende. “The data is collected locally, and reports can be easily generated at any time. Users do not require Remote Sensing/GIS background to achieve good results.”
Collect Earth is part of Open Foris, a set of free and open-source software tools developed by FAO with Google Earth, Bing Maps and GEE to facilitate flexible and efficient data collection, analysis and reporting. It is hosted on GitHub, a platform for collaborative software development.
References
Bastin, J. F., Berrahmouni, N., Grainger, A., Maniatis, D., Mollicone, D., Moore, R., … & Aloui, K. (2017). The extent of forest in dryland biomes. Science, 356(6338), 635-638.
Bey, A., Sánchez-Paus Díaz, A., Maniatis, D., Marchi, G., Mollicone, D., Ricci, S., … & Patriarca, C. (2016). Collect Earth: Land use and land cover assessment through augmented visual interpretation. Remote Sensing, 8(10), 807.