- In part II of our interview with Matt Finer of the MAAP project at Amazon Conservation Association, he explains some of the rapid advances in remote sensing data becoming increasingly available to research and conservation practitioners.
- These advances have allowed the MAAP team to not only detect and monitor deforestation hotspots, but also determine the drivers of forest loss.
- Adapting monitoring procedures and taking advantage of opportunities to use and integrate new tools has allowed the project to remain well-informed of the complex array of drivers causing forest loss in the western Amazon.
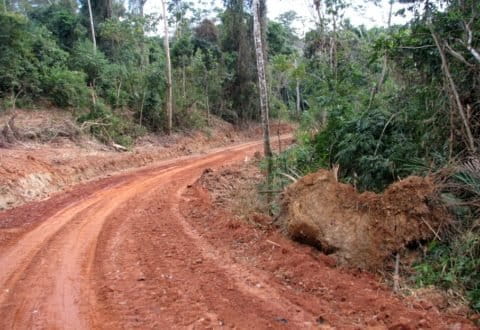
The rainforests of the western Amazon are still relatively intact, but the timber and mineral resources they contain, the increase in small-scale agricultural production, and the often inadequate enforcement of laws protecting forests and indigenous lands have led to an ever-increasing amount of clearing and extraction.
Understanding patterns, hotspots, and drivers of forest loss of forest loss is the primary activity of the Amazon Conservation Association’s Monitoring of the Andean Amazon Project (MAAP). The project combines Landsat images with higher-resolution satellite images from DigitalGlobe and PlanetLabs, RADAR-based imagery, and Global Land Analysis & Discovery (GLAD) forest loss alerts to detect and monitor the status of deforestation events.
In the first part of Wildtech’s interview with Matt Finer, the MAAP project lead, he explained the various remote sensing tools MAAP has been able to integrate and apply to detecting and monitoring deforestation hotspots in near real-time. In this post, Finer explains some of the rapid advances in remote sensing data that are becoming increasingly available to research and conservation practitioners.
Wildtech: What are the greatest threats to the forests in eastern Peru today?
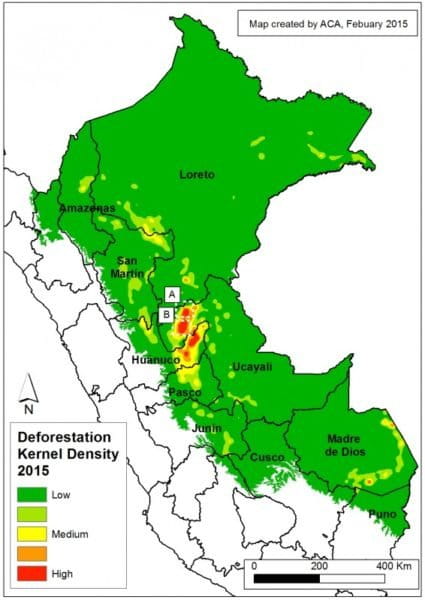
Matt Finer: It’s a complicated answer. Some 70-80% of deforestation in the Peruvian Amazon is small-scale, less than 5 hectares. You need to figure out how to address that really hard small-scale stuff, where you can’t point to any one company—people are slowly chopping down the forest in small bits [for] subsistence agriculture. Kernel analysis can group bunches of these [plots] and show areas of highest density of small-scale deforestation to try and address it as a larger whole.
I think there is a lot of cattle pasture in Huánuco and Ucayali, and a lot of cacao. It’s a mix of small-scale subsistence agriculture, plus smaller-scale oil palm. Once you get a processing plant in an area, you might have the big plantation that started it, but then all of a sudden you have all these little ones because everyone knows they can grow oil palm and sell it – they have a buyer and a processor.


Recent deforestation within the buffer zone of northern Peru’s Cordillera Azul National Park. Red indicates the 2016 GLAD alerts (87.3 hectares of forest lost so far this year). This area is classified as Permanent Production Forest, not as an agricultural area. The high-resolution images of this area (below) between December 2015 (left), January 2016 (center), and July 2016 (right) suggest that new small-scale agricultural plantations are driving deforestation in each of the yellow circles.
Small-scale deforestation is a tough problem to deal with, and on top of that you have this medium-to-large-scale deforestation, that 30% you can see [in maps], [which] is the gold mining and the larger-scale oil palm and cacao plantations. The large-scale stuff is variable—2013 had United Cacao and oil palm plantations, for instance—but 1–2 projects can come along and single-handedly account for 10% of deforestation in the country that year. So it’s important to keep both in mind.
Has MAAP been able to monitor such small-scale deforestation events using primarily remote sensing tools?
When we look at the 2015 [GLAD forest loss alert] annual alert summary data across the deforestation landscape, we felt we did a good job focusing in on where the major problems are. We’re really trying to let the data guide us. We were really pleased that the data showed we were on track.
We are proud of the correlation between the annual [GLAD] data set and the areas we focused in on our MAAP articles. The GLAD alerts [which are updated from all available Landsat images every eight days] come out weekly; another advantage is we got the 2015 annual data in record time—we had this in February of 2016.
How has your work adapted to technology development?
The tech behind this near-real-time monitoring is really dynamic and really exciting. If we had to synthesize our methodology a year ago and now, they’d be very different.
A year ago, the core of our analysis was done with CLASLite. CLASLite served us well in our first year because you take two Landsat images [from different time periods], and it spits out the differences between the two. With our pilot in Colombia and our work in Brazil, we still use CLASLite, but now, for Peru, we mainly use GLAD alerts. Both analyze Landsat imagery, but with CLAS we had to do it manually. With GLAD, the output is similar, but someone else does the analysis!
Also, Landsat’s coverage [of the Earth] is broken up into different scenes, and we’d run CLASLite for a scene for two different periods. And we’d have to do it scene by scene. GLAD does basically the same thing using a different algorithm and, working with Google, just pumps it out for you every week, across the whole [area of interest]. Since you get the data for the whole country, instead of manually comparing two images scene by scene, GLAD is a game-changer.
Also, a year ago, our first step [in identifying deforestation hotspots] was MODIS-based 250m alerts; now we skip straight to GLAD (30m alerts).
Those innovations were cutting-edge technology, but things are advancing so rapidly. You can’t rest on existing technology, because a year from now, there could be a new thing. The field changes so fast, what’s cutting edge now might not be in a year. Maybe there will be a GLAD alert-like system based on RADAR or DigitalGlobe imagery.
Has your use of the alerts changed with the higher resolution?
Each GLAD alert [still] produces a pink splotch on a map. We then go back to the imagery and look at it to confirm what that pink splotch looks like on the image, to confirm [that it is deforestation].
For Peru, at this scale, there are hundreds of thousands of alerts. We do recurring analyses that we know are stories, but another line of research is studying the raw data to see if there are any new hotspots or problem areas.
We’re proud of that hotspot map. Trying to make a map of raw data, it’s just dots everywhere, [so we’re] trying to train our analysis to be like a kernel density analysis….now we’re trying to better understand the bigger picture patterns and drivers of deforestation. So we produced this baseline hotspot map, and then we dive in and try to understand what’s happening in each place.
We recently did an article on the size of the average deforestation event, looking at the ratio of small-scale to large-scale to better understand where our priorities need to be. You have mining, cacao, oil palm, etc, [but] in addition to some of those key case studies that we’ve reported, we also explore the big picture — what all these little case studies add up to in the bigger picture.
What other comparable technologies could you have used instead of CLASlite and GFW?
I think one of the big new revolutions in this area will be RADAR.
We have a good example for using RADAR from the Tambopata region [of Peru]. Using DigitalGlobe [high-resolution satellite imagery], we were able to document the invasion of Tambopata National Reserve in September of 2015, and there were a couple of good Landsat images.
Then for 3-4 months, between January and March, it was cloudy and we knew the invasion was happening but we couldn’t see, so we were using the RADAR quite a bit to monitor how that deforestation process was happening. We’re going to put more and more effort into the RADAR imagery.
The big advance with RADAR is that it used to be really expensive, but the Europeans recently launched Sentinel I, which, like NASA’s Landsat imagery, is free. It’s free but challenging to analyze, because it’s one band. It’s black and white, so it’s tough. Generally, something that is high is white and something low will look darker.
One of my wishes is for someone to develop a CLASLite / GLAD-type algorithm for RADAR, because then there would be zero obstacles. Right now we need to use our eyeballs…
Thinking about the closed-canopy rainforest environment you are monitoring, what limitations or obstacles do you face in your mapping work?
Right now, the big obstacle for us is clouds. If it’s cloudy for 4 straight months, you can’t see anything, but with Sentinel I and RADAR, you have the ability to see through the clouds, and I think the return is every 12 days, and you’d have a pretty constant monitoring.
I think the resolution of the RADAR data is like 5 meters. In fact, there are two different satellites for Sentinel I, as sometimes we get data every 4-7 days… I would guess it updates on a weekly basis. If you had an algorithm like CLASLite or GLAD, it was be easy.
What technology do you wish you had, but currently lack?
It would be the GLAD-type alerts based on RADAR. There’s recently been a huge advance in the world of RADAR. RADAR has existed but it was always really expensive, but now with the launch of Sentinel I, you have this constant supply of fresh new RADAR, and it’s free.
So, as I mentioned, the next logical step should be to improve the analysis algorithms. To analyze RADAR, as it’s just that 1 band, takes a lot of skill. Landsat has 8 or 11 different bands. There are ways to analyze those bands to visualize where there has been forest loss, but with just one, it’s hard to do that. It would be nice to have some additional tools to analyze RADAR.
 |
 |
Two views of the Peruvian Amazon canopy from below. Photo credits: Sue Palminteri
What role do you see technology playing in forest conservation in the Amazon over the next decade or so?
Doing near-real-time, high-resolution monitoring really speaks to average folks much more than historical monitoring. If you can show a hi-res image of deforestation that happened two weeks ago, that resonates with people – in the news and even the Facebook world. These get a lot of likes and things. You could talk about the same deforestation event, and it gets much more traction if you talk about it happening two weeks ago than “3 years ago”.
Near-real-time, hi-res monitoring has the potential to greatly improve Amazon conservation efforts—conservation anywhere, really—because it makes it more real than a moderate resolution image from five years ago. This is happening now.
Do you have any tips for aspiring conservationists working with remote sensing for forest monitoring?
It’s a really exciting time to be in this field, doing this type of near-real-time monitoring. It took until 2013 to get the baseline 2000-2012 deforestation trends. Now we have this high-resolution, near-real-time deforestation data. It’s totally unprecedented. It’s a great time to be in the deforestation monitoring movement because the technology is so dynamic and evolving so quickly.
For Andes-Amazon, we are in this moment where there is still a lot in play. The story isn’t written yet – the forest isn’t totally destroyed yet, but it’s certainly not good to go. Your average person might think the Amazon is taken care of now, but we’re seeing with this near-real-time monitoring that there are still vast tracts of rainforest but it’s still getting hacked. Big time.
It’s a critical time now to be part of this. How do we make sure that we conserve what we need to conserve? There’s a lot at stake, and the pressures and threats keep escalating, so the next 10 years will be critical in determining how this region will look over the long term. It’s one of those last big moments where we can influence how much of this great Amazon we can have.