
- The online Global Forest Watch platform provides open access to frequently updated satellite imagery to allow any user to monitor forest change in a given country or other area.
- Within an interactive map, the user can view forest change data and related spatial data sets at scales ranging from a 30m x 30m pixel to the whole globe – basic user guidelines provided in this post.
- Speeding detection of forest loss improves management, conservation, and accountability.
As human development expands across the globe, forest loss in remote areas, including protected areas, often goes undetected until large areas have been cleared. Greater transparency to reveal the condition of forest habitat at high spatial resolution is increasingly central to not only halting forest loss directly, but also planning effective conservation strategies for forest-dependent species.
To speed detection of forest loss and provide greater transparency of forestry practices, several initiatives are enabling online forest monitoring. The most easily available of these is Global Forest Watch (GFW), a free online forest monitoring and analysis tool the World Resources Institute (WRI), Google, ESRI and the University of Maryland launched in 2014.
Given its open access and global reach, we believe a consolidated basic summary-in a series of articles-would benefit readers interested in using the tool. The GFW site itself provides an extensive set of user-friendly guides and tutorials.

What it does
The Global Forest Watch (GFW) online platform compiles and uses satellite imagery, other spatial data sets and related algorithms to identify where trees are growing and disappearing. GFW applies this information to display up-to-date global tree cover and detect forest loss and gain worldwide. GFW updates its global map of tree cover* annually (from 2000 to 2014) at 30m x 30m resolution and bi-weekly at 500m resolution. The platform aims to provide open access to timely information aiding forest management and conservation worldwide.
How people use it
The tool is free, so anyone with internet can access the information on forest cover, loss and gain at a variety of scales. Its creators want different sectors to take from GFW what they need to inform their work. Thus,
- government agencies can monitor concessions, detect illegal deforestation and better enforce forest laws;
- companies that trade commodities, such as soy and palm oil, can assess their supply chain’s deforestation impact;
- NGOs can target their forest and biodiversity conservation efforts;
- journalists can gather evidence and better hold all of these institutions accountable and
- researchers can model risk and future land use trends.
In fact, mongabay.com uses the tool regularly to add maps to stories on deforestation and other destructive land uses.
To introduce this powerful tool, this post highlights several basic “where to’s” and “how to’s,” including links to related instructional materials on the GFW website.
1) How to view tree cover, loss and gain worldwide and in your selected area
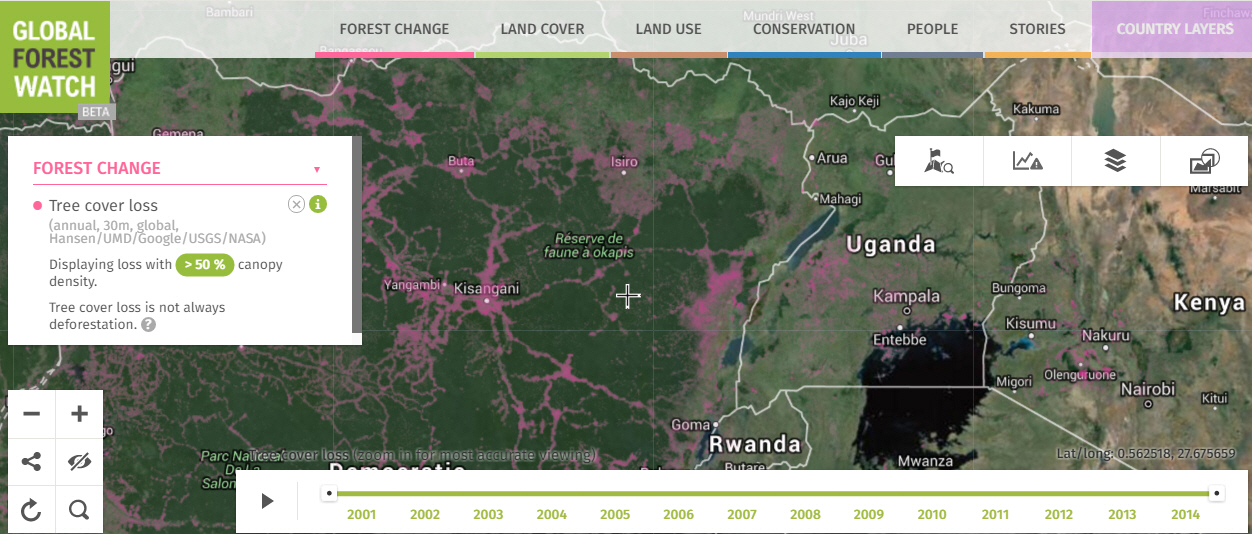
On the GFW website homepage, scroll down and click on the icon for the Interactive Map. This is where you can view all forest change and related data layers in one place. This main page highlights the world’s forests and areas of forest loss (in pink) and gain (in blue) at 30m resolution.
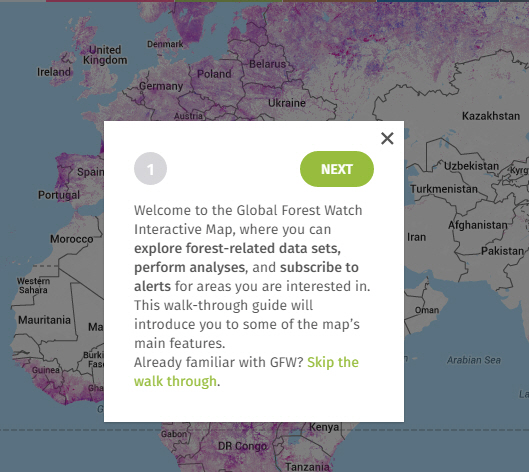
The interactive map initially offers step-by-step instructions on its various features, and you can revisit each of these in a tutorial.
The instructions highlight the (1) tabs at the top of the screen containing different categories of data you can add to your map; (2) data legend at the left displaying the different data layers already on your map; and (3) navigation features to zoom in to see the information in better detail or zoom to a particular location in the world.
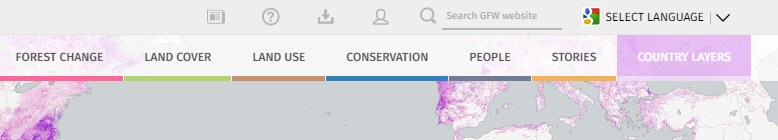
To add data layers to overlay with the forest change data, click on the category tabs at the top of the map.
Each tab brings up a menu of additional global data sets—including forest cover, land use, mangrove forests, fires occurring over the past day or week, dams, protected areas and human population density—to appear with the layers showing global tree cover loss and gain.
You can also overlay data sets specific to certain countries, including tree and palm oil plantations, mining concessions, logging roads and land use rights.
A box at the right of the map presents a menu of environments with four icons, where you can:
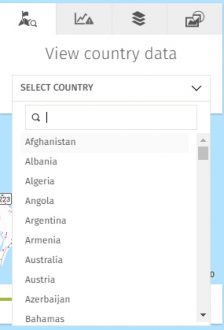
- view the data available for a particular country, as the platform includes additional land use data sets on tree plantations, mining and logging concessions, indigenous territories and other features for certain countries;
- select a country, protected area or other region for which you want to view the tree cover data (see image);
- change the underlying base map to show roads, elevation, terrain, current satellite imagery or Landsat imagery from a particular year since 1999;
- add high-resolution imagery for your selected area (redrawing large image files for a large area might take a while).
Once you select a country, you can add or remove the data layers you want to view for that country alone; this expedites the computer redraw and crops the data at the country’s boundaries.
2) How to view statistics on forest cover
What if you want to go beyond viewing and generate numbers or statistics on tree cover in your region of focus?
To view statistics on a particular country, navigate to the GFW home page and select “Country Profiles & Rankings.”
- To compare countries, choose “Country Rankings.” Here you can see countries with the greatest tree cover, tree cover loss and tree cover gain, by area and percentage of the baseline tree cover from the year 2000.
- To view data on one country, choose Country Profiles; then select the country. The main country page gives you basic information on areas of tree cover and tree cover loss and gain, followed by the number of “FORMA” (500m x 500m resolution) tree cover loss alerts. You can also view this information for a subsection of the country, such as a state or province.
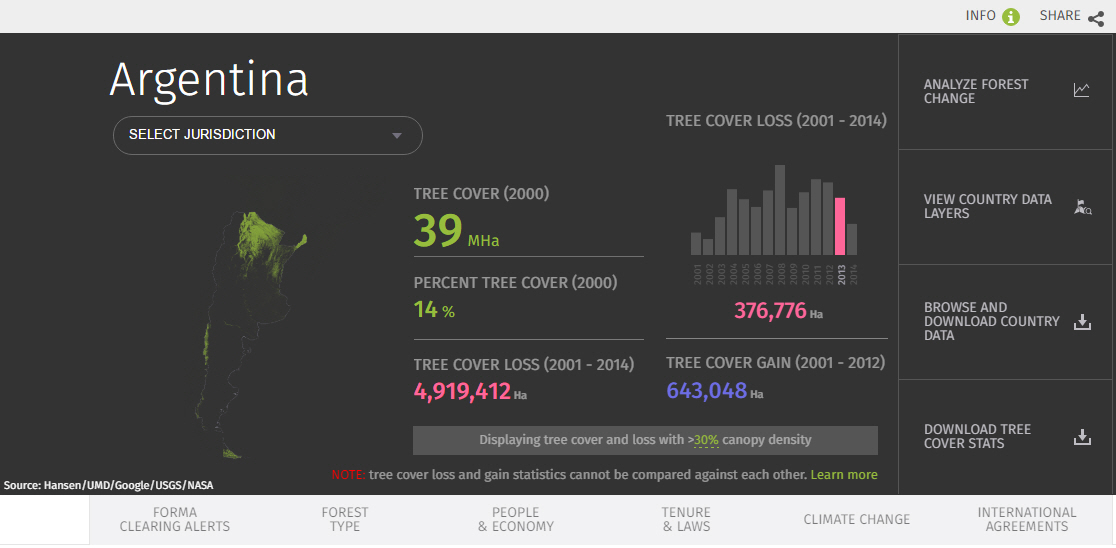
Click on the large buttons at the right of the black header section (see image above for Argentina) to download country data or be redirected to view the data on the interactive map.
Below this initial information are tabs for other data on your selected country, including:
- metric tons of above-ground carbon stocks;
- percentage in natural versus regenerating or plantation forest;
- national economic value of the forestry sector, including the number of people working in forestry-related jobs;
- national forested land owners and managers and
- international forest-related conventions the country has signed.
Each statistic and graph has a little green circle with an (I) next to it that you click for a pop-up box with information about how that data is derived.
3) How to find and download data
To download the data you are viewing online, navigate to the Open Data Portal (ODP) via this link or the ODP icon found at the top or bottom of the Interactive Map.

The ODP section of GFW uses ESRI’s Open Data to enable searches for specific data sets using keywords (just below the map), data categories (e.g. forest use data), or country names. You can view a description or metadata about each data set.
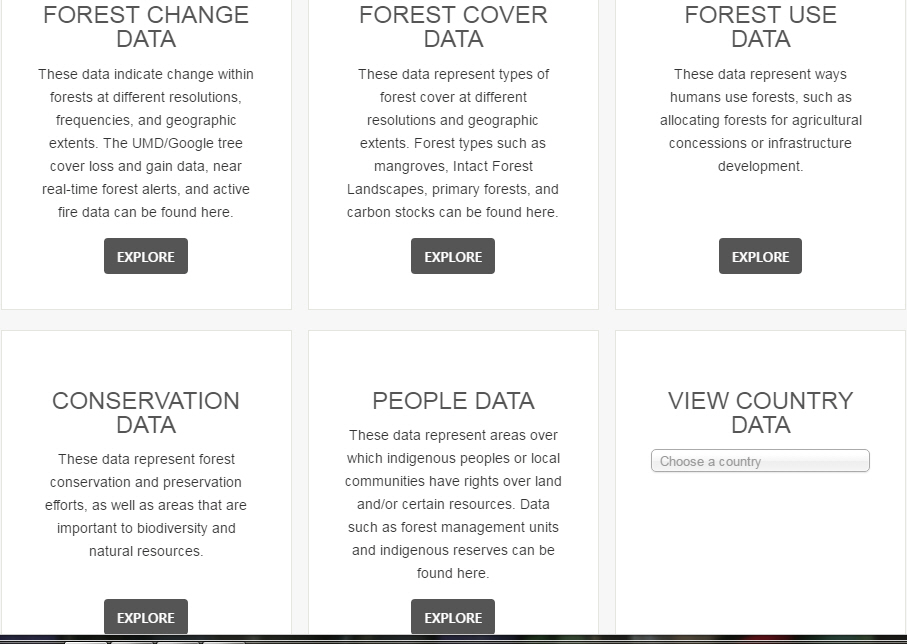
You can also search for data visually by zooming in on a region of interest in an interactive map. When you start a map search, the map will present boxes showing the type and spatial extent of data sets available for that region; choose from a list of data sets below the map. You can view a given data set on a map and filter what you download either by data attributes or a particular area of the map.
Those working with spatial data can download data sets, including the main tree cover loss data, in various formats, including .CSV, .SHP, KML, JPEG, PNG and TIFF, or access the API, and add them to other mapping tools such as ArcMap, Google Earth and ArcGIS Online.
This GFW blog post highlights improvements to the search, view and download features made last year, with links to how and where to use them. Here is the how-to video and tutorials for the Open Data Portal.
Getting help
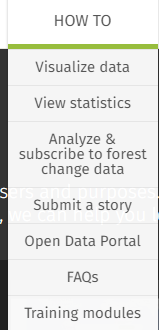
New users can visit GFW’s “How-To” page for tutorials, videos and instructions on how to use the various tools. Training modules and Frequently Asked Questions cover in greater detail the options mentioned here and other topics. Additionally, the GFW team welcomes feedback.
Interaction
Users can also share their field data and stories via GFW crowdsourcing tools, blogs and discussion groups.
You can also overlay data layers and analyze forest change online within the GFW platform, which is helpful for those without GIS access. An upcoming post will highlight several useful tools for forest and wildlife managers.
Finally, GFW’s alert system allows you to subscribe to information from an area of the world and receive email alerts if tree cover is being lost there. This feature is also substantial enough to merit its own “basics” post–coming soon.
Other online tools
Other online tools for monitoring forests and biodiversity, which may become the focus of future posts, include:
- The Carnegie Landsat Analysis System (CLASlite) is a Carnegie Institute and Stanford University initiative that enables automated identification of deforestation and forest degradation from satellite imagery at a very fine (sub-pixel) scale. CLASlite offers a free online forest monitoring course; those who pass the exam receive one year of free software license with potential for free renewals.
- The Design and Analysis Tools for Inventory and Monitoring (DATIM) is a new United States Forest Service tool that helps the USFS analyze vegetation data in forests and surrounding landscapes, monitor sites or stands of forest and plan future data collection.
- The Digital Observatory for Protected Areas (DOPA) is a set of web services and interfaces that allows users to assess, monitor and potentially forecast the state of and pressure on protected areas at multiple scales. The DOPA Explorer is a web-based tool assessing a set of indicators on ecosystems, climate, phenology, species, ecosystem services and pressures on nearly 16,000 protected areas.
Disclaimer: The GFW partnership is convened by the World Resources Institute, a partner of wildtech.mongabay.com.
*NOTE that tree cover in GFW can include tree plantations that resemble forest in satellite imagery, so knowledge of an area is key to accurately identifying forest change.