- SkyTruth’s FrackFinder project combines remote sensing, cloud computing, and an engaged public to identify precise fracking locations.
- Volunteers locate signs of fracking on aerial images while learning the impact and extent of fracking infrastructure.
- Medical researchers examine the relationships between proximity to fracking sites and incidences of human health effects.
How do you motivate people to learn and care about their environments? Researchers in various scientific fields have begun involving interested people in collecting data on the ground, verifying data online, and contacting authorities and each other to act on existing data. Connecting those data to human health impacts may engage the public even more.
The goal of SkyTruth is to motivate people to use satellite imagery, geospatial data, and digital mapping tools to personally investigate what’s happening—good and bad—in the places that they care about.
This and other groups download detailed aerial imagery free, or nearly so, from government entities, including NASA, NOAA, and the US Department of Agriculture, and use it to allow the public to see what’s happening around us from a point of view impossible to gain otherwise.
An earlier WildTech post detailed SkyTruth’s history, how the group obtains and applies big remotely sensed data sets to improve environmental awareness and industrial transparency in projects such as Global Fishing Watch, and where they see remote sensing technology headed in the next five years.
As part of that same interview, WildTech asked SkyTruth founder John Amos and Chief Technology Officer Paul Woods how their team has used cloud computing to integrate high-tech, remotely sensed data with public participation to heighten awareness of environmental change, using their FrackFinder project as a case study.
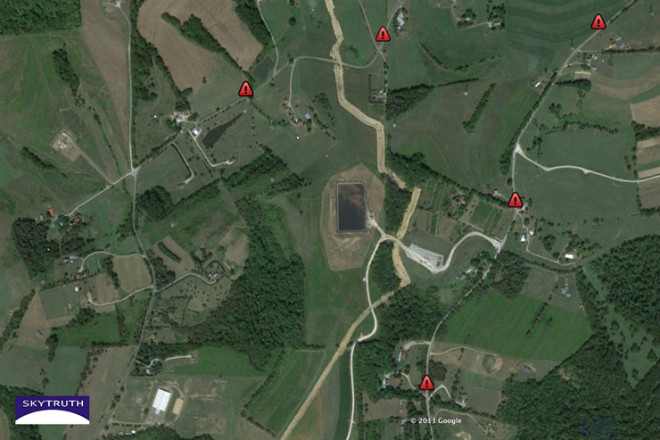
The FrackFinder project maps sites where drilling for natural gas using hydraulic fracturing (fracking) activity occurs across the northeastern United States, employing crowdsourced analysis of aerial and satellite imagery. With the uncertain effects of fracking activities on health, the project aims to produce a GIS dataset that public health researchers can consult to explore any connections between gas drilling, fracking and public health.
They embarked on this mission after meeting with Brian Schwartz, a epidemiology professor at the Johns Hopkins Bloomberg School of Public Health, who had read about SkyTruth and wanted to compare fracking site locations to digital medical records that his research group had access to on hundreds of thousands of patients in Pennsylvania. They wanted to know whether air pollution coming off the fracking well pads and ponds was affecting the health of nearby residents, but government maps of “unconventional gas production” lacked the locations, sizes, and dates of active use for all the fracking wastewater ponds.
WildTech: How can citizen science play a role in remote sensing?
PAUL: In FrackFinder, we took a different approach [from our Global Fishing Watch project]. We want to know what activities happened around fracking events and where they happened: when the drilling actually happens, when waste water ponds were created, the extent of the fracking pad, where trees were cleared, etc.
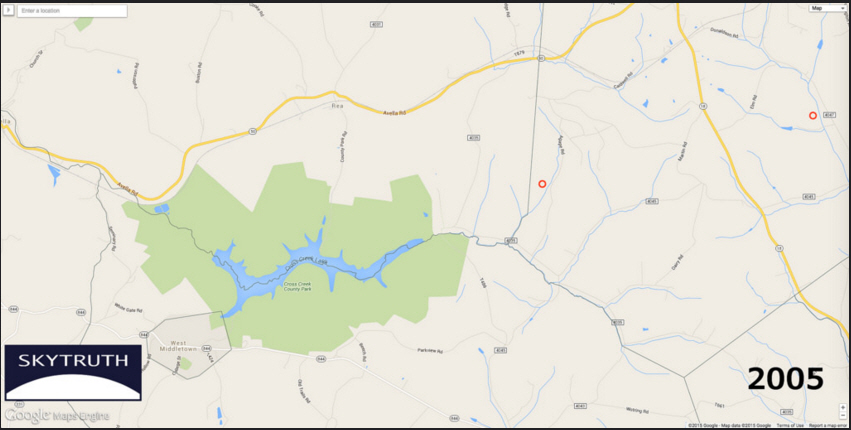
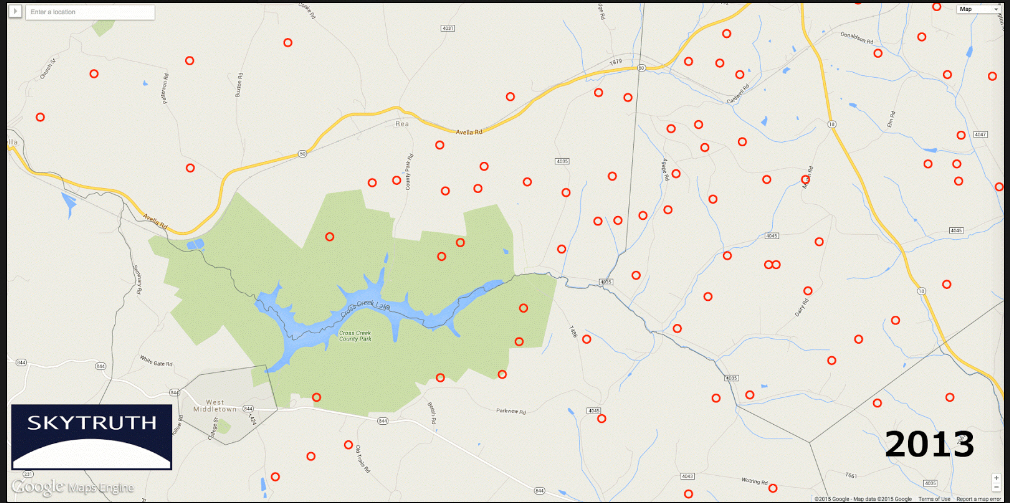
[SkyTruth used satellite and aerial imagery to identify fracking sites, track activity at those sites from 2005 through 2013, and map the extent of the visible surface impact from every frack site visible in the images. With thousands of fracking sites nation-wide, the team asked volunteers to help review the many images and classify what they see.]
Our system loaded all the high-res imagery for the entire state of Pennsylvania into in the cloud, where it was easy to work with, and then we used data from the state of where and when permits were issued. We cut out and looked at one square kilometer of just the area where the permit happened, and just the time when it actually happened, which narrowed the relevant imagery down to about 90,000 shots.
To process those images to find actual fracking sites, we made a web tool to let the volunteers sign up to help. We designed it so they could go through the images very quickly, and we trained them on how to identify fracking wells and ponds – we said “if you see a pond that looks like this, click on it”. They could do 50 to 100 of those in a minute so with 1,000 volunteers you move through 90,000 pretty quickly.
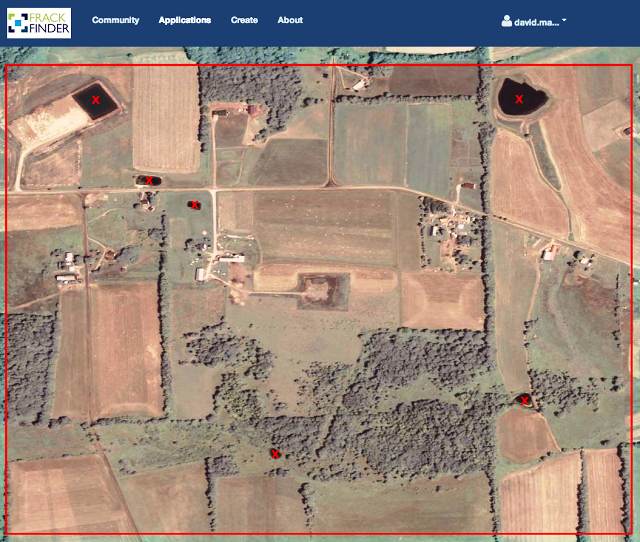
We then fed this whole bunch of data from the clicks back into the system and asked volunteers to tell us what kind of pond it is, and we drew a line around each fracking pond which the crowd had identified to see how big it is. By the end, we had some pretty rich data that we handed off to researchers at Johns Hopkins University to use for a public health study.
JOHN: So that’s an example of what we call “collaborative image analysis”. I like that better than crowdsourcing because crowdsourcing’s kind of a generic and top-down term. Here we’re working with the volunteers every step of the way. You have to put a lot of work in to set these types of projects up to get the quality results from a dispersed worldwide set of volunteers. So there’s no freebies, but we are very excited by the potential of this.
There are a number of collaborative image analysis projects out there such as Tomnod, a crowdsourcing platform owned by DigitalGlobe, a satellite company. They collect a bunch of high-res satellite imagery of natural disasters and humanitarian crises, and then put it up in the cloud and ask volunteers to come help them search for things or identify things.
Ours are more strategically oriented at helping us map and create unique GIS datasets showing the footprint of resource extraction activities. So the FrackFinder programs in the series of these collaborative image analysis projects that Paul mentioned are designed to produce data unobtainable through any other means to inform public health studies. In this case, it’s to answer the pressing societal question of “Is fracking bad?” in a quantitative and scientifically robust way.
[The volunteers—many of them anonymous—logged on to SkyTruth’s FrackFinder website and used the pond-finder tool to identify fracking ponds and wells. With the information posted by the volunteers over the course of several months, the project produced maps that pinpoint every fracking pond that appeared in these key areas of Pennsylvania in 2005, 2008, 2010, and 2013.
The SkyTruth team didn’t know how many volunteers would participate, how much work each would do, and whether the resulting data would be robust. They were pleasantly surprised by the numbers and enthusiasm of the volunteers—“armchair citizen scientists”—who reviewed the online images. The most dedicated participants analyzed more than 4,000 photos each, though a few hundred is more typical, and together, the volunteers identified and confirmed hundreds of ponds around active well pads.]
WildTech: How do you estimate the accuracy of the volunteers’ identifications?
We act as the primary filter, but then we’re enlisting the help of interested people everywhere to help us finish it off. I also wanted to point out that those 90,000 image analysis tasks that we cued up in the first round of the FrackFinder project — we thought it would take months, and within three weeks, a couple hundred volunteers had pounded out the whole thing.
And this analysis was done at a level of 10x redundancy, so we had about 9,000 sites that we needed to look at, and we wanted at least 10 volunteers to look at every site. We would then compare their judgements and come up with a QAQC process where, when we reach the circle of crowd-agreement, we agreed with the crowd 100% of the time (Amos and other experts reviewed split decisions); therefore we could confidently publish that result.
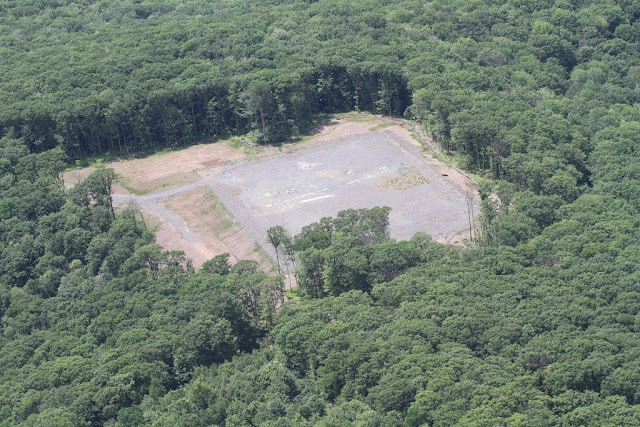
[The citizen-scientist analysis of aerial survey imagery, validated by SkyTruth’s experts, has found at least 2,724 active industrial operations (those with permits and evidence of clearing or construction) spread across the fields and forests of Pennsylvania. From these data, SkyTruth has produced an interactive map of active sites across Pennsylvania from 2005-2013. The resulting maps show the locations of more accurately and comprehensively than government drilling permits did.]


WildTech: Do you know what kind of people are volunteering on these projects?
It’s been fascinating to see all the different people participating. One of the outstanding volunteers was asking for more tasks to do: he’d hit our ceiling of 5,000 tasks per person, and we thought no one would ever get close to that. Within a couple of weeks, this guy had hit the 5,000 limit, and so Paul emailed him back and basically (in a more polite way) said ‘who the hell are you??’
It turned out he was a guy from Pennsylvania but he was living and working in Japan and he was doing these tasks on his iPad on his daily commute on the train into Tokyo. We thought, “Wow, if we can find a person like that, just randomly, how many more people might be like him out there whom we could tap to help move the ball forward in science and public policy?” It seems like the sky is the limit if we could just get smarter with how we cue up and execute these kinds of projects.
WildTech: Very innovative. How did the volunteers find you? Did you market to them?
JOHN: We’re lousy at marketing. That’s one thing we’re really not very good at. It was our limited social media reach- we’ve got a few thousand followers on Twitter and Facebook and it’s outreach that way, through some listservs that we’re on. For one of the early stages of that project, it helped that the Washington Post Sunday magazine ran a profile of SkyTruth that came out while we were in the early stages of one of those projects.
WildTech: How do you see SkyTruth tools and resulting visuals making an impact on the public and decision-makers – in government and industry?
JOHN: I’ll say the one thing – it’s a very intangible outcome from this- it’s heightened public engagement- not just public awareness but public engagement. With the collaborative image analysis project, we could probably do that more efficiently and quickly if we simply hired some analysts in-house and just did all of the work that way. But then we would lose the hundreds of people scattered throughout society who would not have been repeatedly exposed to the graphic visceral imagery showing a landscape impact of natural gas drilling on the Pennsylvania countryside. We don’t have metrics to assign a tangible value to that, but I just have a feeling that the more people who are exposed to imagery of resource extraction operations and other environmental concerns, the more activist society as a whole will become on environmental conservation and environmental protection.
One side effect of [accessible satellite data] will be that a growing number of people will be informed and attentive to environmental changes and will increasingly have the tools to see what companies are doing anywhere, anytime. I think that is going to become a tidal-wave force for accountability, and for proactive governments and industry players, an opportunity for them to proactively do things better. Knowing the public will see that will help separate them from the rest of the pack.
Our main motivation here is to show people what’s happening in the environment and primarily things that are happening that are, you know, our fault. That’s generally been bad stuff so far, [though] we’re actually looking for satellite imagery that shows, you know, good stories of environmental change that’s also our “fault”.
If you do have aerial images that show good environmental stories or have combined imagery with citizen science data, please leave a comment to let others know!