Kenneth MacDicken and Francesco Tubiello work at the Food and Agriculture Organization of the United Nations (FAO). The views expressed in this commentary are their own.
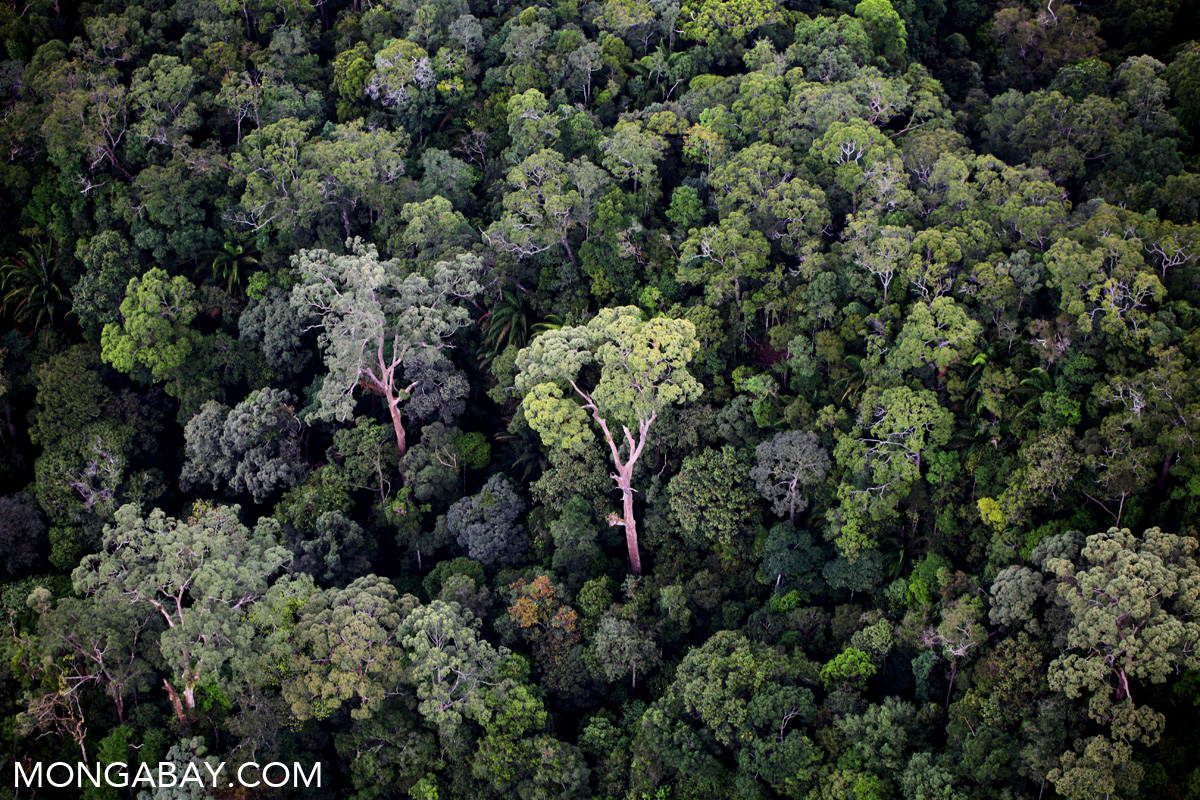
Old-growth rainforest in Malaysian Borneo. Photos by Rhett A. Butler
Understanding forest dynamics is necessary for the sound management of forests, for both production and conservation. This includes an understanding of the extent of forest area, information about what the forest contains and how the forest resource is managed. Forest monitoring provides this information.
While the public at large and policymakers alike need transparent technical information to implement effective actions, recent assessments by the scientific community on forest area loss and especially deforestation have instead been contradictory, generating unnecessary confusion.
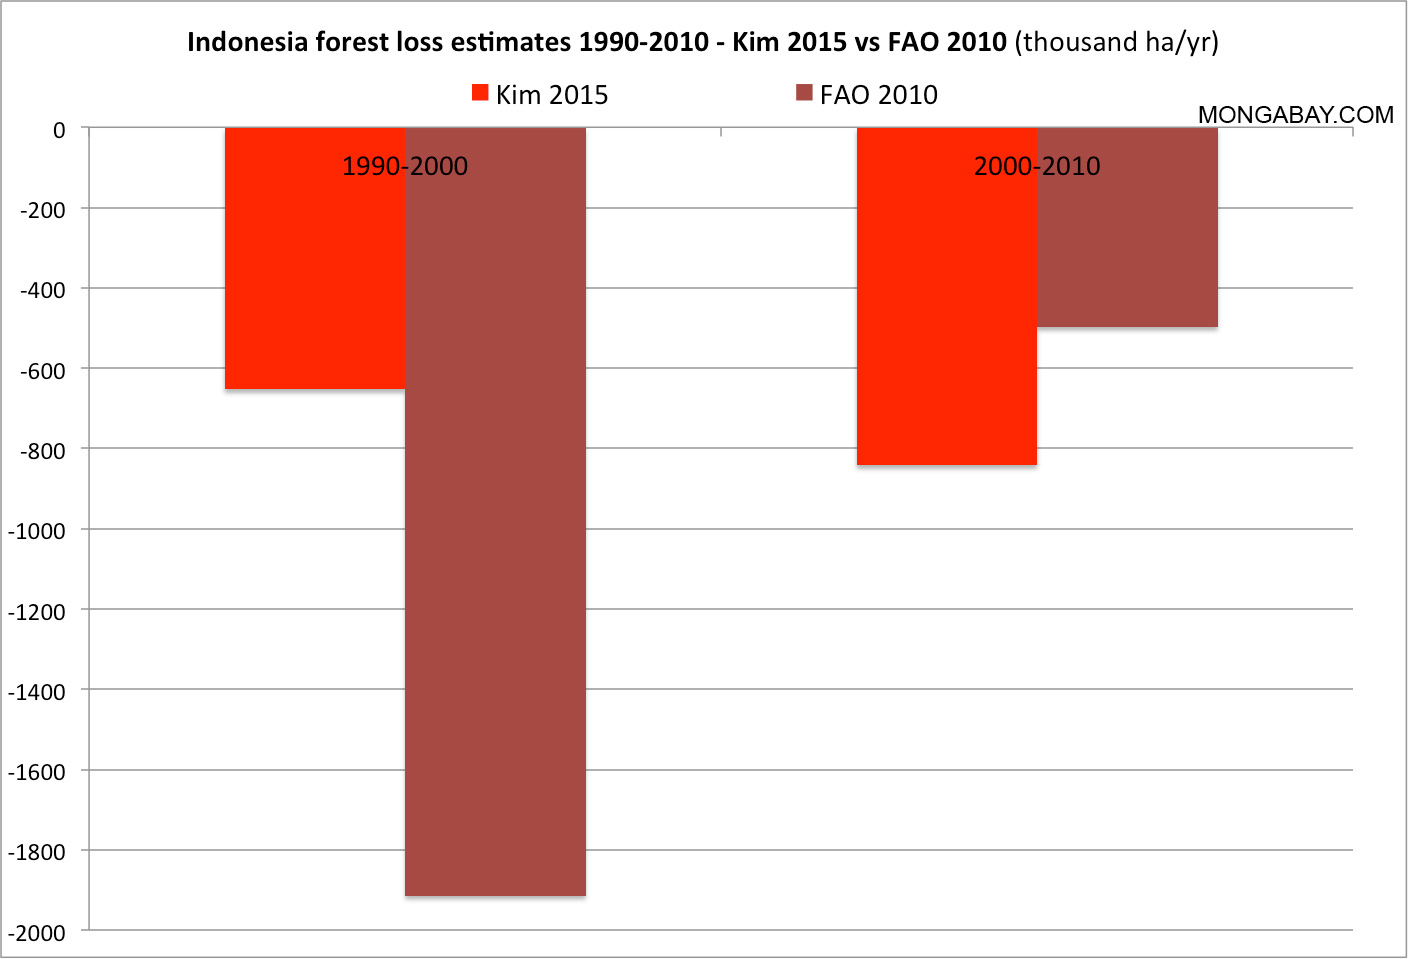
Information on forest dynamics is routinely provided by countries through the Global Forest Resources Assessment (FRA) of the Food and Agriculture Organization of the United Nations (FAO). FRA reports generally come from a combination of ground-based measurement/assessment and remote sensing at the national scale. FRA results have pointed to steady decreases in deforestation rates over recent decades as well as the concentration of net forest loss in the tropics. Recently scientists monitoring tree cover from space have reported, however, that deforestation has instead been increasing, especially in the tropics (see recent paper by Kim et al., 2015).
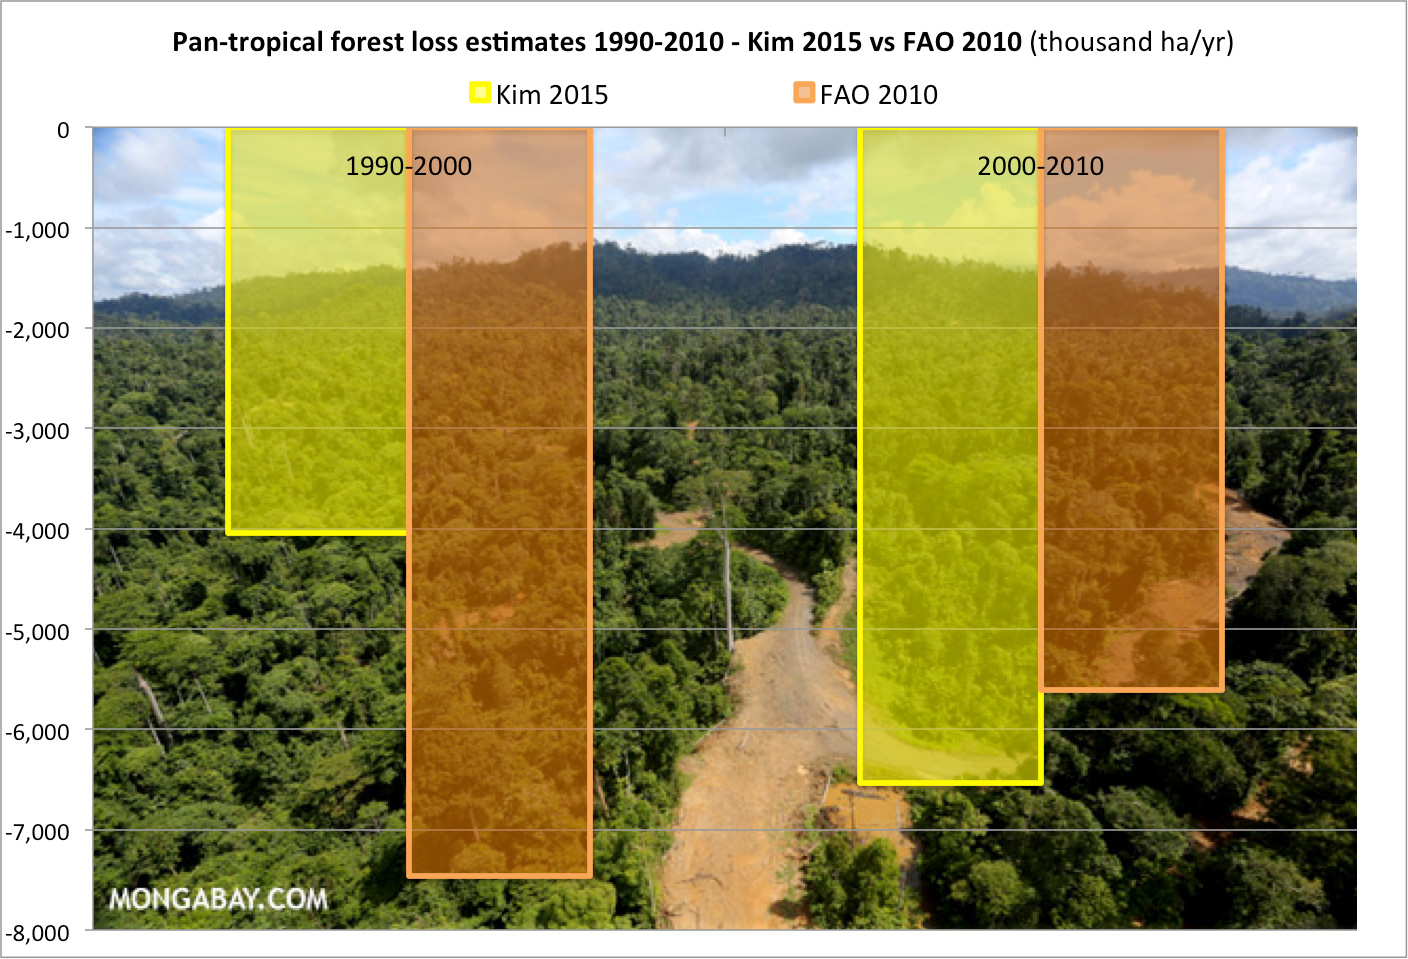
Click charts to enlarge
These apparently opposing assessments of forest loss are unfortunate – primarily because they do not report on the same thing- therefore the differences are misleading. Fortunately, it can be shown that they are primarily due to the use of different definitions of forest. To put it simply, while the FAO and International Panel on Climate Change (IPCC) approaches focus on the forest rather than the trees, the remote sensing-based approach presented by Kim et al. sees some of the trees, but largely misses the forest.
Countries report all of the above information to FAO, and have done so consistently over the past several decades through the Global Forest Resource Assessment (FRA), which encourages the use of uniform parameter definitions for reporting. The ensuing FRA country reports have therefore provided for decades a coherent, freely accessible global database of forest area, biomass and other key socioeconomic and environmental variables, based on official national data. Reports generally contain descriptive data on sources and calculations and all reports are publicly available online in their entirety (www.fao.org/forestry/fra).
FRA has been, and is still, a huge success. In fact, it is these reports that first provided the data that pointed to forest loss in the tropics as well as the basis for understanding the role of forests in climate change. Because deforestation is associated with changes in land use rather than land cover alone, the United Nations Framework Convention on Climate Change (UNFCCC) employs a definition of national forests in line with FAO’s definition for key mechanisms such as the Kyoto Protocol and REDD+. Additionally, the terrestrial carbon cycle community, and more recently the FAOSTAT Emissions database, use FRA data to assess forest carbon stock change accounting methods that are routinely reported in high-impact literature and synthesized by IPCC for analyses of greenhouse gas emissions and carbon sinks from deforestation and land use change.
Case closed? Not so fast, say some in the remote sensing community, and rather strongly at that. Kim et al. question the FRA data while touting the superiority of space-derived information. FRA data, they maintain, are a collection of poorly-documented national reports, and suffer from heterogeneous data quality that makes the resulting global database a poor choice for global assessments. By contrast, they point out that thanks to exponential improvements in satellite and information technology, they have begun counting trees from detailed imagery largely collected through the U.S. Geological Survey Landsat Project. This methodology includes applying a set of constant land cover forest thresholds in order to compute globally consistent databases of forest tree cover change. Unfortunately, as we argue below in our detailed response to the Kim et al. (2015) paper, the ensuing forest tree cover change is then erroneously reported as “deforestation,” and that’s where the trouble begins.

Most large-scale remote sensing assessments fail to account for degradation from logging.
Have the recent satellite-based efforts helped advance the science? Absolutely. Are they opening new ways for countries to be able to better identify their own forests and trends with the help of advanced technologies? Certainly.
But ask instead this question: Have these new methods helped clarify trends in historical deforestation? Here the answer is a resounding no. As noted above, remote sensing information generally does well at seeing tree cover in most forest types, but is still unable to see the forest – which is substantially more complicated than tree cover. This is evidenced by the fact that the differences between Landsat-based global forest estimates are often greater than the differences between ground-based FRA reporting and Landsat-based remote sensing estimates. This is true even for remote sensing results from the same university (e.g. see Kim et al. and Hansen (2013) cited in Beuchle et al, 2015).
In fact, whereas temporary losses of tree cover are mistakenly seen as deforestation by satellites, country reports –despite the criticism of data quality for some reports —can critically differentiate between forest cut-and-growth cycles, including degradation on the one hand and deforestation on the other. They also differentiate between forest and other tree crops such as oil palm or fruit trees, which are all counted as “forest” in Kim et al. and other similar remote sensing studies.

Deforestation for an oil palm plantation in Malaysia. Photos by Rhett A. Butler
Additionally, satellite images used to date do not provide sufficiently robust information on tree species, stocking rates, stem diameters, height or biomass that are essential in understanding forests. In addition national assessments report other aspects of forests and forest management that are not possible to collect from space, including forest tenure and access rights, the status of sustainable forest management, legal and institutional frameworks for forest conservation and sustainable use, etc. Ground surveys and expert judgment is needed for all of that – elements that are not possible in global Landsat analyses of tree cover. Understanding of this set of complex forest characteristics is best made by countries themselves which generally work hard to provide the best possible information regarding their forests.
Comparing the results coming from two different methodologies, remote sensing and FRA, is therefore inappropriate, exactly like comparing apples and oranges. Indeed, if confidence intervals or other measures of uncertainty were placed around remote sensing values for tree cover, they would generally be statistically the same as the reports provided through the FRA.


For all of the above reasons, it is inappropriate to claim that Landsat-based estimates of tree cover area provide more reliable estimates than those available through FRA country reports. We urge caution in the use of Kim et al. and other similar papers as a means of understanding forest loss and gain in the tropics.
These two approaches should rather be seen as complementary, and increased efforts developed to make best use of this increasing wealth of information. For instance, this week FAO will make available for the first time ever, global estimates of emissions from deforestation and, separately, from forest degradation. The XIV World Forestry Congress in September 2015 will see the release of the next FRA, which promises to provide new insights into forest extent, change, management and use. The new data should be combined to help shed more light on the recent tree cover trends seen from satellites. Stay tuned.
|
Seeing the trees but not the forest – Technical linked material Mongabay recently reported rates for loss of forest area in humid tropical forests based on a recent paper by Kim and colleagues . This paper has received a great deal of media attention because it reports increasing forest loss in the tropics, whereas FRA 2010 reported a reduction in the loss rate. In particular, the Kim et al. (2015) paper suggests that where Landsat-based analysis and ground-based reports are combined, the resulting information is more consistent and should be seen as a preferred source of forest area data, compared to the FRA. These statements, repeated by the authors through their paper and reinforced via an online piece at Geophysical Research Letters, are incorrect. Here is why: 1. Landsat analyses are most useful to determine tree cover, unless accompanied by substantial ground-based measurement or higher resolution image analysis. Landsat images see oil palm and apple trees as natural forest – even when assumptions are made about where forest should be, as done in the Kim et al. analysis. Forest area analysis can be assisted with Landsat data – but must include additional work to ensure that tree cover is in fact correctly associated with forest cover. |
CITATIONS:
- Kim, D.-H., Sexton, J.O. & Townshend, J.R. 2015. Accelerated deforestation in the humid tropics from the 1990s to the 2000s. Geophysical Research Letters
- Hansen, M.C., Potapov, P.V., Moore, R., Hancher, M., Turubanova, S.A., Tyukavina, A., Thau, D., Stehman, S.V., Goetz, S.J., Loveland, T.R., Kommareddy, A., Egorov, A., Chini, L., Justice, C.O. & Townshend, J.R.G. 2013. High-resolution global maps of 21st-century forest cover change. Science, 342: 850-853.
- FAO, JRC, 2012. Global forest land-use change 1990–2005. FAO Forestry Paper No. 169. Rome, FAO.
- Beuchle, R., Grecchi, S.C., Shimabukuro, Y.E., Seliger, R., Eva, H., Sano, E. & Achard, F. 2015. Land cover changes in the Brazilian Cerrado and Caatinga biomes from 1990 to 2010 based on a systematic remote sensing sampling approach. Applied Geography, 58: 116-127.
The original version of this post stated “This is evidenced by the fact that the differences between Landsat-based global forest estimates are often greater than the differences between ground-based FRA reporting and Landsat-based remote sensing estimates. This is largely due to the use of different parameter sets and even sensors. This is true even for remote sensing results from the same university.” The sentence “This is largely due to the use of different parameter sets and even sensors” was subsequently deleted at the request of the authors.