NASA’s Landsat program turns 40
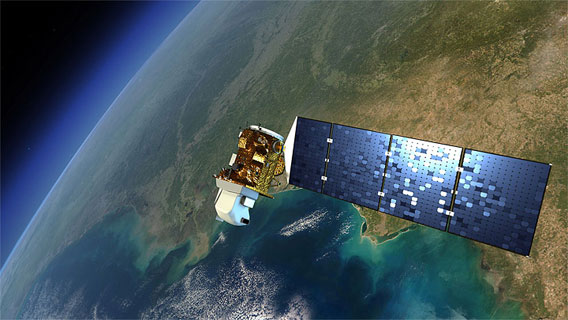
Landsat Data Continuity Mission. (NASA)
Landsat, NASA’s Earth-observing satellite program, turned 40 on Monday. The space agency celebrated by releasing some of the program’s best images showing how landscapes have changed in the past 40 years, including the five most popular ‘Earth as Art’ images.
The first Landsat satellite was launched July 23, 1972. Six successive launches followed, including Landsat 5 and Landsat 7 which are still in operation.
Today Landsat imagery is used in a wide range of applications, including serving as the basis for Google Earth. Landsat data has been used in innumerable scientific studies, ranging from mapping deforestation to monitoring crops to mapping changes. The next Landsat satellite, the Landsat Data Continuity Mission (LDCM), is scheduled for launch in 2013.
Winners of the “Earth as Art” vote
These were the five winning images after a public vote online. Captions courtesy of NASA.
5th Place: Lake Eyre Landsat 5 Acquired 8/5/2006

a jack-o-lantern face of white smokey blobs rimmed with blue on ochre/orange fields The scary face in this image is actually inundated patches of shallow Lake Eyre (pronounced “air”) in the desert country of northern South Australia. An ephemeral feature of this flat, parched landscape, Lake Eyre is Australia’s largest lake when it’s full. However in the last 150 years, it has filled completely only three times. (Credit: NASA’s Goddard Space Flight Center/USGS)
4th Place: Algerian Abstract Landsat 5 Acquired 4/8/1985

What look like pale yellow paint streaks slash through a mosaic of mottled blue and smoke colors like azurite What look like pale yellow paint streaks slashing through a mosaic of mottled colors are ridges of wind-blown sand that make up Erg Iguidi, an area of ever-shifting sand dunes extending from Algeria into Mauritania in northwestern Africa. Erg Iguidi is one of several Saharan ergs, or sand seas, where individual dunes often surpass 500 meters (nearly a third of a mile) in both width and height. (Credit: NASA’s Goddard Space Flight Center/USGS)
3rd Place: Meandering Mississippi Landsat 7 Acquired 5/28/2003

Small, blocky shapes of towns, fields, and pastures surround the graceful swirls and whorls of the Mississippi River, the largest river system in North America. Countless oxbow lakes and cutoffs accompany the meandering river south of Memphis, Tennessee, on the border between Arkansas and Mississippi. (Credit: NASA’s Goddard Space Flight Center/USGS)
2nd Place: Yukon Delta Landsat 7 Acquired 9/22/2002

Countless lakes, sloughs, and ponds are scattered throughout this scene of the Yukon Delta in southwest Alaska. One of the largest river deltas in the world, and protected as part of the Yukon Delta National Wildlife Refuge, the river’s sinuous waterways seem like blood vessels branching out to enclose an organ. (Credit: NASA’s Goddard Space Flight Center/USGS)
1st Place: Van Gogh from Space Landsat 7 Acquired 7/13/2005

In the style of Van Gogh’s painting “Starry Night,” massive congregations of greenish phytoplankton swirl in the dark water around Gotland, a Swedish island in the Baltic Sea. Population explosions, or blooms, of phytoplankton, like the one shown here, occur when deep currents bring nutrients up to sunlit surface waters, fueling the growth and reproduction of these tiny plants. (Credit: NASA’s Goddard Space Flight Center/USGS)
World of Change
Captions and images courtesy of NASA
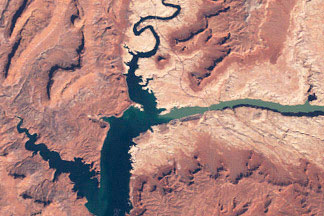
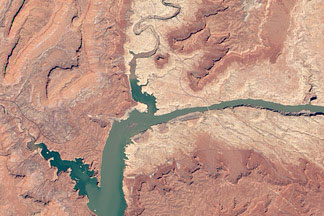
Water Level in Lake Powell
 |
 |
|
| March 25, 1999 | April 20, 2012 |
Combined with human demands, a multi-year drought in the Upper Colorado River Basin caused a dramatic drop in the Colorado River’s Lake Powell in the early part of the 2000s. The lake began to recover in the latter part of the decade, but as of 2012, it was still well below capacity.
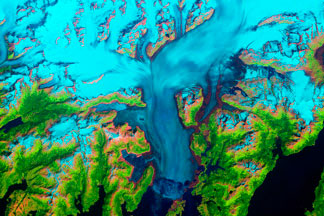
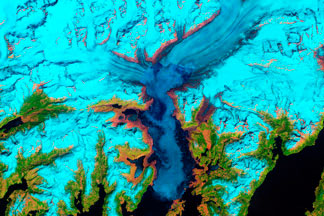
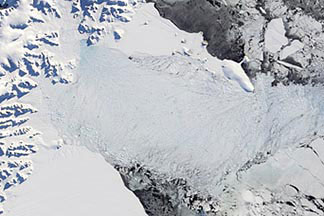
Columbia Glacier, Alaska
 |
 |
|
| July 29, 1986 | May 30, 2011 |
Since 1980, the volume of this glacier that spills into the Prince William Sound has shrunk by half. Climate change may have nudged the process along, but mechanical forces have played the largest role in the ice loss.
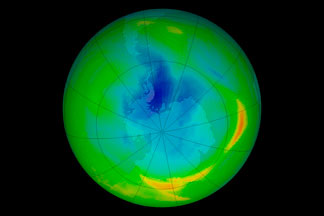
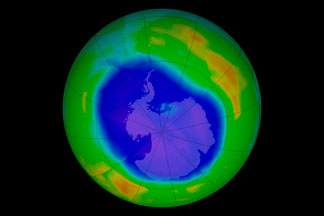
Antarctic Ozone Hole
 |
 |
|
| September 17, 1979 | September 12, 2011 |
In the early 1980s, scientists began to realize that CFCs were creating a thin spot—a hole—in the ozone layer over Antarctica every spring. This series of satellite images shows the ozone hole on the day of its maximum depth each year from 1979 through 2010.
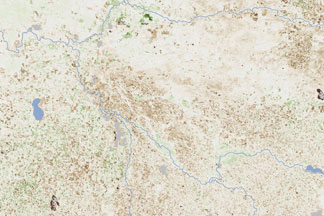
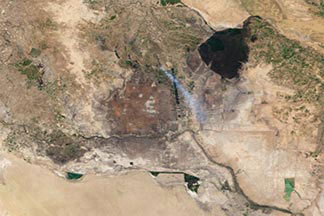
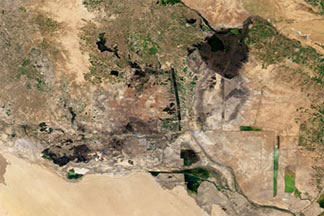
Drought Cycles in Australia
 |
 |
|
| mid-September 2000 | mid-September 2011 |
Droughts have taken a severe toll on croplands in Southeast Australia during the past decade.
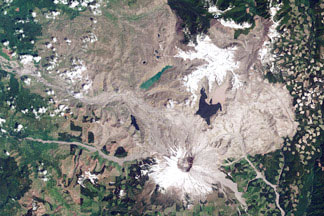
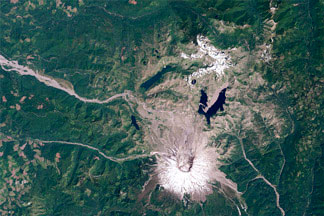
Recovery at Mt. St. Helens
 |
 |
|
| June 17, 1984 | July 30, 2011 |
The devastation of the May 1980 eruption of Mt. St. Helens and the gradual recovery of the surrounding landscape is documented in this series of satellite images from 1979—2011.
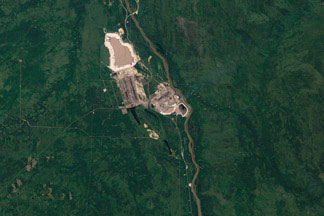
Athabasca Oil Sands
 |
 |
|
| July 1984 | May 2011 |
The Athabasca Oil Sands are at once a source of oil, of economic growth, and of environmental concern. This series of images shows the growth of surface mines around the Athabasca River from 1984 to the present.
Burn Recovery in Yellowstone
 |
 |
|
| 1989 | 2011 |
In 1988, wildfires raced through Yellowstone National Park, consuming hundreds of thousands of acres. This series of Landsat images tracks the landscape’s slow recovery through 2011.
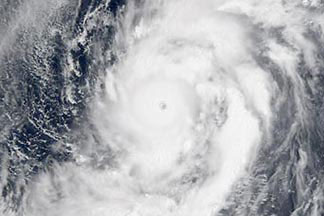
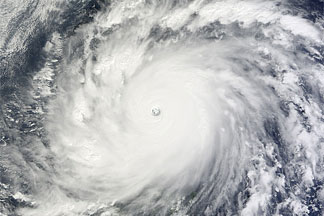
Severe Storms
 |
 |
|
| Damrey, 2000 | Megi, 2010 |
This collection features the strongest hurricane, cyclone, or typhoon (from any ocean) during each of the past 11 years, including storms both infamous and obscure.
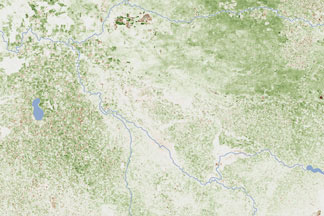
Seasons of the Indus River
 |
 |
|
| June 6, 2009 | June 9, 2010 |
Fed by glaciers in the Himalayas and Karakorams mountains — and by monsoon rains — the Indus River experiences substantial fluctuations every year. Because the river irrigates 18 million hectares of farmland, the landscape changes along with the river.
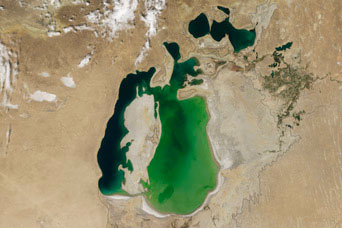
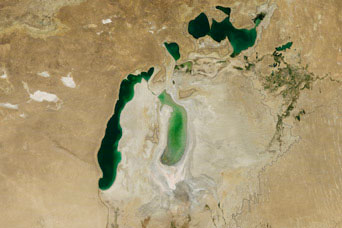
Shrinking Aral Sea
 |
 |
|
| August 19, 2000 | August 15, 2011 |
A massive irrigation project has devastated the Aral Sea over the past 50 years. These images show the decline of the Southern Aral Sea in the past decade, as well as the first steps of recovery in the Northern Aral Sea
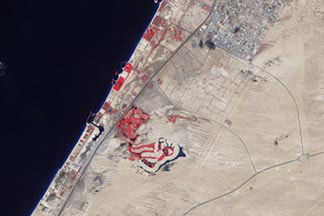
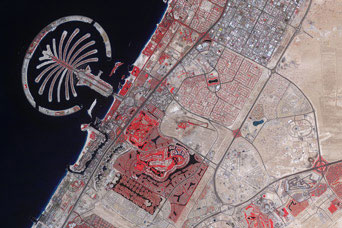
Urbanization of Dubai
 |
 |
|
| November 11, 2000 | April 25, 2011 |
To expand the possibilities for beachfront tourist development, Dubai, part of the United Arab Emirates, undertook a massive engineering project to create hundreds of artificial islands along its Persian Gulf coastline.
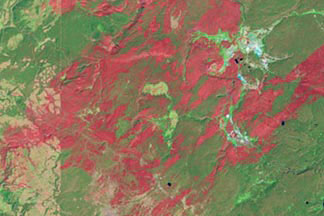
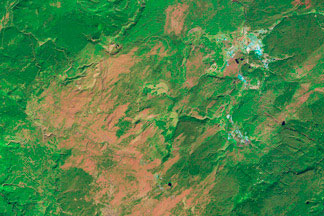
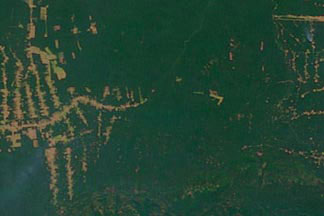
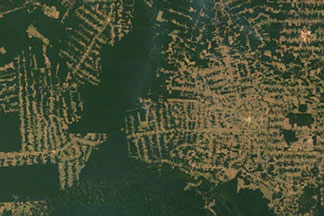
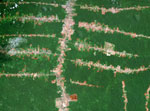
Amazon Deforestation
 |
 |
|
| July 20, 2000 | August 2, 2010 |
The state of Rondônia in western Brazil is one of the most deforested parts of the Amazon. This series shows deforestation on the frontier in the northwestern part of the state between 2000 and 2010.
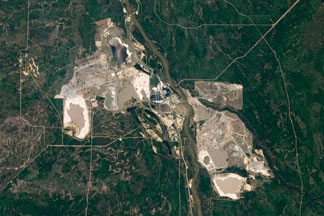
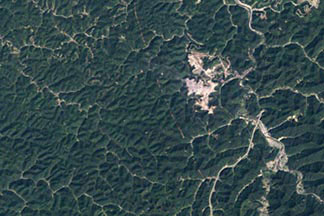
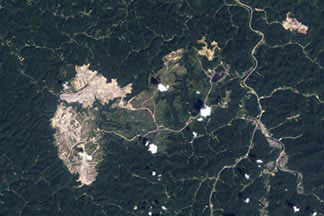
Mountaintop Mining, West Virginia
 |
 |
|
| September 17, 1984 | August 8, 2010 |
Based on data from NASA’s Landsat 5 satellite, these natural-color (photo-like) images document the growth of the Hobet mine in Boone County, West Virginia, as it expands from ridge to ridge between 1984 and 2010.
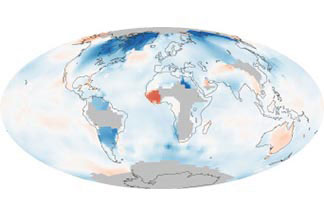
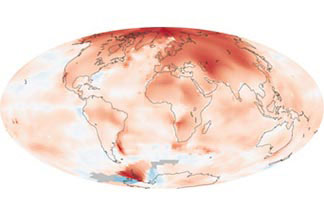
Global Temperatures
 |
 |
|
| 1880 – 1889 | 2000 – 2009 |
The world is getting warmer, whatever the cause. According to an analysis by NASA scientists, the average global temperature has increased by about 0.8°Celsius (1.4° Fahrenheit) since 1880. Two-thirds of the warming has occurred since 1975.
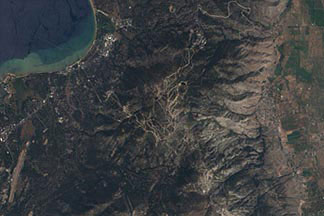
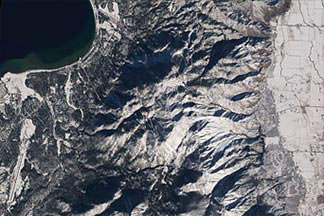
Seasons of Lake Tahoe
 |
 |
|
| August 27, 2009 | December 23, 2009 |
Perhaps the most familiar change in our changing world is the annual swing of the seasons. This series of images shows the effects of the seasons on the Lake Tahoe region between 2009 and 2010.
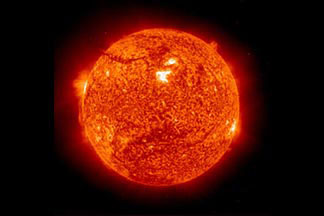
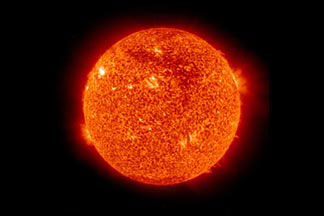
Solar Activity
 |
 |
|
| April 29, 1999 | May 2, 2010 |
Images of sunspots and UV brightness document the 11-year cycle of solar magnetic activity. The series spans 1999–2010, capturing the most recent solar maximum and minimum, as well as the emergence of solar cycle 24.
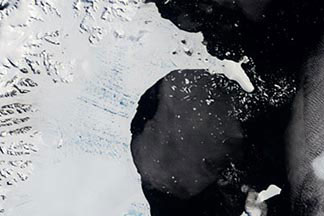
Larsen-B Ice Shelf
 |
 |
|
| January 31, 2002 | April 13, 2002 |
In early 2002, scientists monitoring daily satellite images of the Antarctic Peninsula watched in amazement as almost the entire Larsen B Ice Shelf splintered and collapsed in just over one month. They had never witnessed such a large area disintegrate so rapidly.
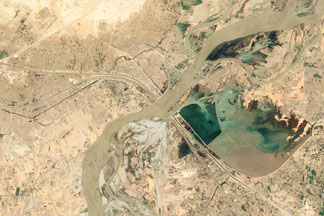
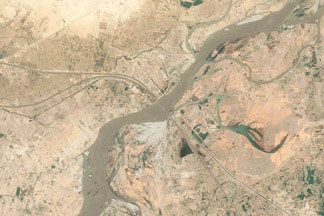
Mesopotamia Marshes
 |
 |
|
| February 28, 2000 | February 8, 2010 |
In the years following the Second Gulf War, Iraqi residents began reclaiming the country’s nearly decimated Mesopotamian marshes. This series of images documents the transformation of the fabled landscape between 2000 and 2010.
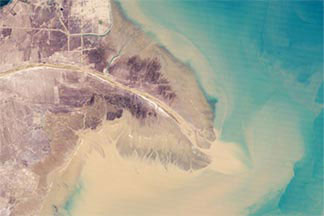
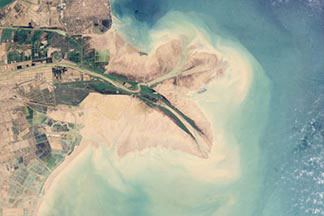
Yellow River Delta
 |
 |
|
| February 13, 1989 | June 20, 2009 |
Once free to wander up and down the coast of the North China Plain, the Yellow River Delta has been shaped by levees, canals, and jetties in recent decades.
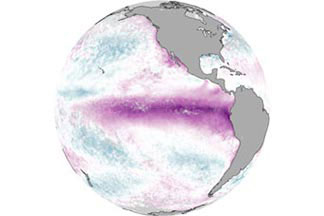
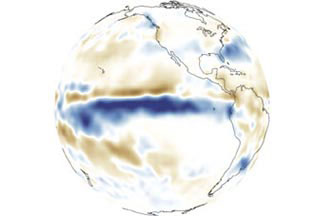
El Niño, La Niña, and Rainfall
 |
 |
|
| Sea Surface Temperature Anomaly, December 1997 | Rainfall Anomaly, Dec 1997 |
For many people, El Niño and La Niña mean floods or drought, but the events are actually a warming or cooling of the eastern Pacific Ocean that impacts rainfall. These sea surface temperature and rainfall anomaly images show the direct correlation between ocean temperatures and rainfall during El Niño and La Niña events.
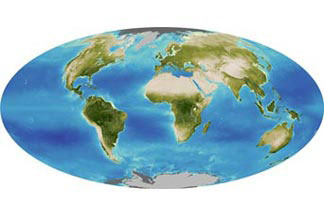
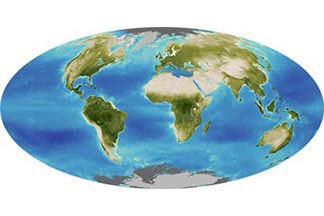
Global Biosphere
 |
 |
|
| 1999 | 2008 |
Earth would not be the planet that it is without its biosphere, the sum of its life. This series of images illustrates the variations in the average productivity of the global biosphere from 1999 to 2008.
Related articles
How satellites are used in conservation
(04/13/2009) In October 2008 scientists with the Royal Botanical Garden at Kew discovered a host of previously unknown species in a remote highland forest in Mozambique. The find was no accident: three years earlier, conservationist Julian Bayliss identified the site—Mount Mabu—using Google Earth, a tool that’s rapidly becoming a critical part of conservation efforts around the world. As the discovery in Mozambique suggests, remote sensing is being used for a bewildering array of applications, from monitoring sea ice to detecting deforestation to tracking wildlife. The number of uses grows as the technology matures and becomes more widely available. Google Earth may represent a critical point, bringing the power of remote sensing to the masses and allowing anyone with an Internet connection to attach data to a geographic representation of Earth.
Development of Google Earth a watershed moment for the environment
(03/31/2009) Satellites have long been used to detect and monitor environmental change, but capabilities have vastly improved since the early 1970s when Landsat images were first revealed to the public. Today Google Earth has democratized the availability of satellite imagery, putting high resolution images of the planet within reach of anyone with access to the Internet. In the process, Google Earth has emerged as potent tool for conservation, allowing scientists, activists, and even the general public to create compelling presentations that reach and engage the masses. One of the more prolific developers of Google Earth conservation applications is David Tryse. Neither a scientist nor a formal conservationist, Tryse’s concern for the welfare of the planet led him develop a KML for the Zoological Society of London’s EDGE of Existence program, an initiative to promote awareness of and generating conservation funding for 100 of the world’s rarest species. The KML allows people to surf the planet to see photos of endangered species, information about their habitat, and the threats they face. Tryse has since developed a deforestation tracking application, a KML that highlights hydroelectric threats to Borneo’s rivers, and oil spills and is working on a new tool that will make it even easier for people to create visualizations on Google Earth. Tryse believes the development of Google Earth is a watershed moment for conservation and the environmental movement.