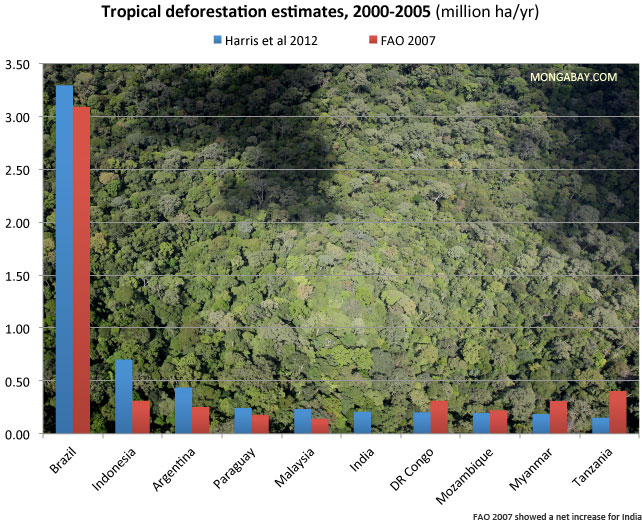
 Countries with the highest gross forest loss between 2000 and 2005 according to the new study and earlier work by the FAO. Click image to enlarge. |
Tropical deforestation accounted for 10 percent of global carbon dioxide emissions between 2000-2005 — a substantially smaller proportion than previously estimated — argues a new study published in Science.
The authors — led by Nancy Harris of Arlington, VA-based Winrock International and including scientists from Applied GeoSolutions, NASA’s Jet Propulsion Laboratory and the University of Maryland — used satellite-based analyses of tropical forest carbon stocks and tropical forest cover. Unlike other deforestation emissions estimates, the team did not rely on data from the U.N. Food and Agriculture Organization, which is the standard global source for deforestation statistics but suffers from poor data quality in some countries. The researchers also departed from the conventional approach of aggregating data and calculations over large geographic regions, instead using multi-sensor satellite data calibrated with field studies.
“It’s time to acknowledge the problems with the FAO data and accept that we can now do much better,” said Winrock’s Dr. Sandra Brown, a co-author of the study, in a statement. “We have the ability, at last, to match the areas of forest clearing with their carbon stocks before clearing in much greater detail, allowing us to pinpoint more precisely where the highest emissions are occurring.”
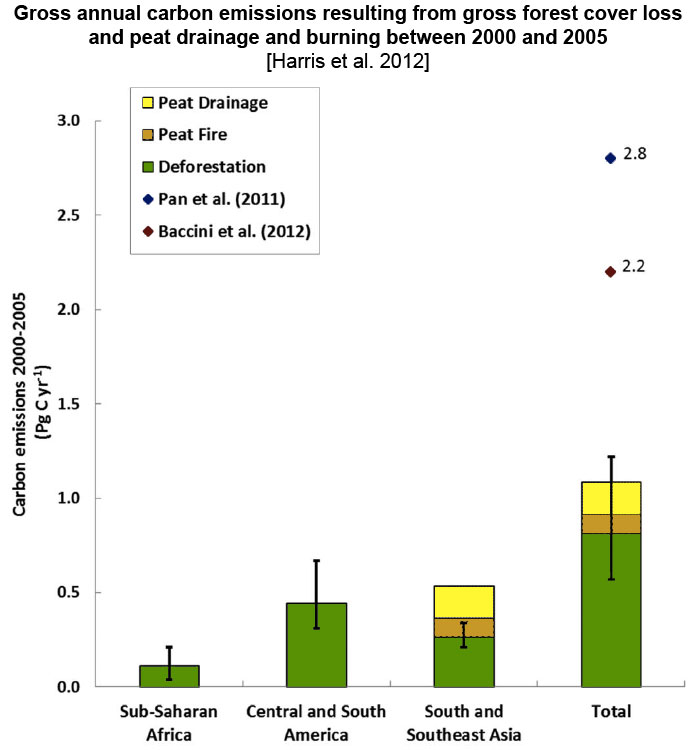 Gross annual carbon emissions resulting from gross forest cover loss, peat drainage and burning between 2000 and 2005 compared to recently published estimates by Pan et al. (2011) and Baccini et al. (2012) for an overlapping time period (2000-2007 and 2000-2010, respectively). Error bars represent 90% prediction intervals around median deforestation emission estimates. The estimates from Pan et al. and Baccini et al. do not include peat emissions. Caption courtesy of Harris et al (2012). Image adapted from the paper. Click image to enlarge. |
The paper estimates gross carbon emissions from deforestation at 810 million metric tons (with a 90 percent confidence interval of 0.57-1.22 billion tons) per year from 2000-2005, significantly below earlier calculations. Brazil and Indonesia accounted for 55 percent of gross emissions from tropical deforestation during the study period, while dry forests accounted for 40 percent of tropical forest loss but amounted to only 17 percent of emissions.
But the study does not give a complete picture of emissions from land use. It does not account for carbon sequestered by forest regrowth or carbon emissions from forest degradation, which in some years can can rival those from deforestation. The Science paper also does not include emissions from land use change in temperate regions.
The results of the paper contrast sharply with another study published earlier this year in Nature Climate Change. That paper, authored by Alessandro Baccini and colleagues, also used high resolution satellite imagery but relied on a different methodology. Their study period covered 2000-2010.
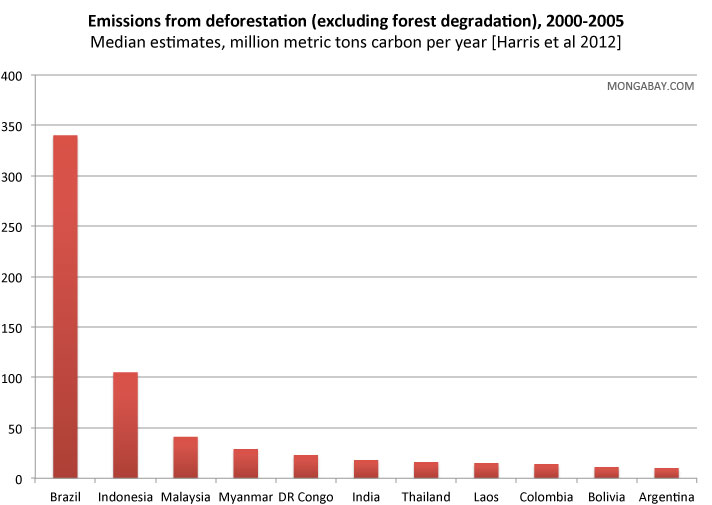 Countries with the highest emissions from deforestation between 2000 and 2005 according to the new study. Click image to enlarge. |
The difference in the emissions estimates between the two papers has raised eyebrows.
“The large difference between the two estimates may result from definitional and methodological issues; the explanation is not immediately apparent, and the magnitude of the difference remains surprising, particularly given the similarity between the underlying forest carbon stock data,” wrote Dan Zarin of the Climate and Land Use Alliance in a commentary published in the same issue of Science. “A difference of this magnitude in tropical deforestation emissions estimates between two state-of-the-art analyses is also cause for concern in climate policy circles.”
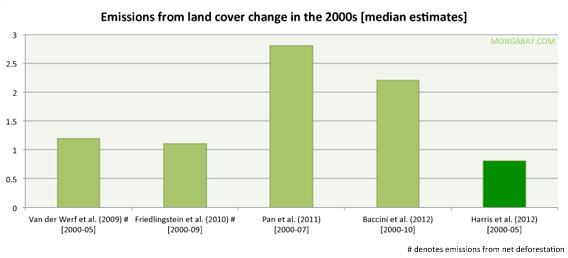 Deforestation emissions estimates for the 2000s |
“It would benefit both the science and policy communities if the two research groups could determine the reasons for the 1.41 billion ton of carbon per year difference in their results soon, and do so with sufficient transparency for others to evaluate.”
The estimates have significant policy implications. The U.N.’s Reducing Emissions from Deforestation and Degradation (REDD+) programs aims to cut greenhouse gas emissions by paying tropical countries to protect their forests. The program could generate billions of dollars a year in finance, but accurate data is needed to ensure proper levels of performance-based compensation.
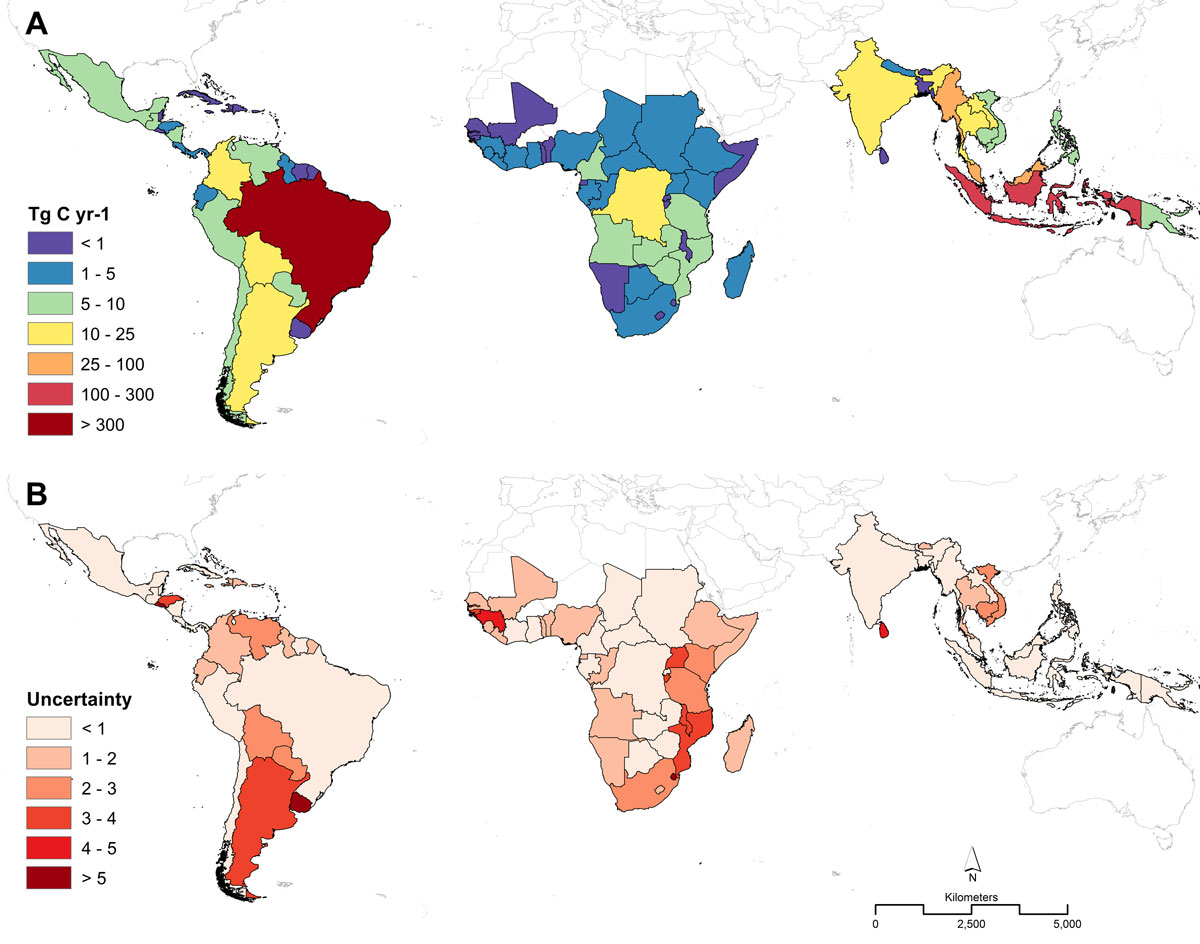 Relative ordering of (A) deforestation emissions between 2000 and 2005 and (B) uncertainty in emissions estimates by country. Uncertainty is estimated as the ratio of the range of emission values within the 90% prediction interval to the median emissions estimate. Image and caption courtesy of Harris et al (2012). Click image to enlarge. 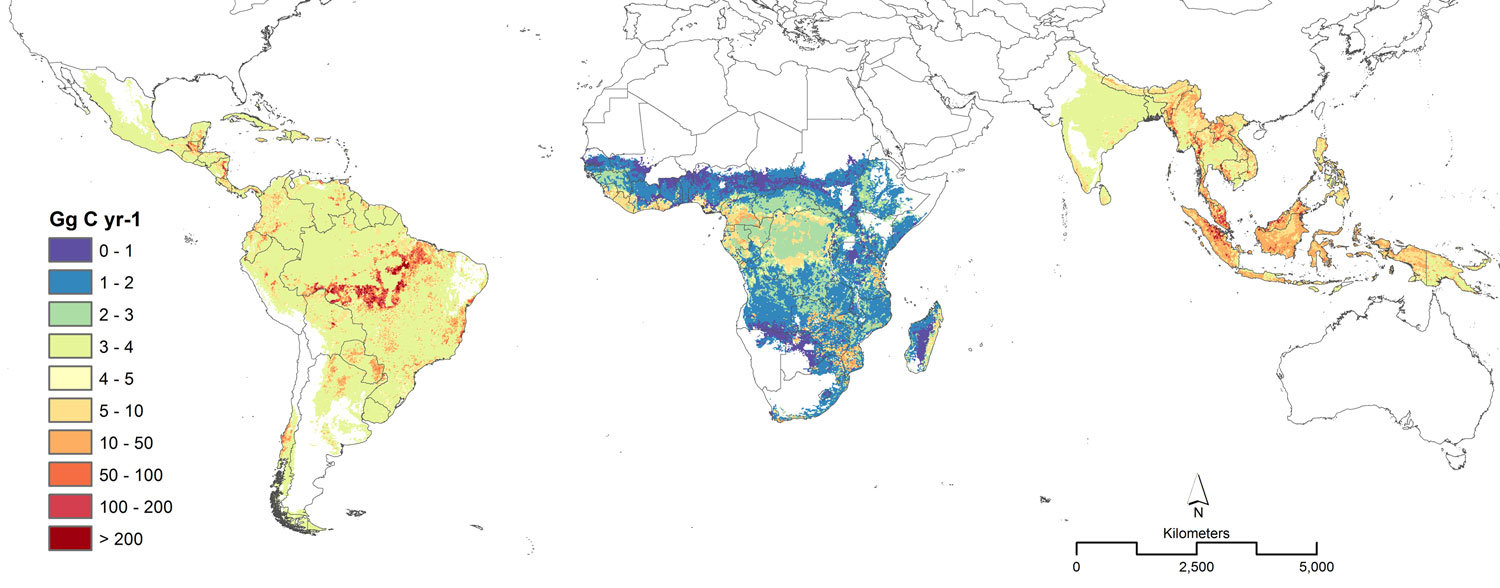 Distribution of annual carbon emissions from gross forest cover loss between 2000 and 2005 mapped at a spatial resolution of 18.5 km. Image and caption courtesy of Harris et al (2012). Click image to enlarge. |
Related articles