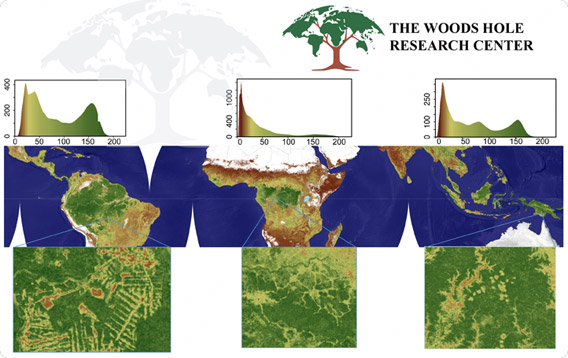
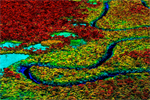
Biomass map. Courtesy of WHRC. Click here for a zoom-able version.
Tropical rainforests store some 229 billion tons of carbon in their vegetation — about 20 percent more than previously estimated — finds a new satellite-based assessment published in the journal Nature Climate Change. The findings could help improve the accuracy of reporting CO2 emissions reductions under the proposed REDD program, which aims to compensate tropical countries for cutting deforestation, forest degradation, and peatlands destruction.
The paper is based on a combination of remote sensing and field data across forests, woodlands, and savannas in tropical Africa, Asia, and South America. The authors used multi-sensor satellite data, including cloud-penetrating LiDAR, to reduce the degree of error in estimating carbon stocks. They found that Brazilian forests store some 53.2 billion tons of carbon, followed by forests in the Democratic Republic of the Congo, with 22 billion tons of carbon, and Indonesia, with 18.6 billion tons of carbon. Overall, forests in the Americas stored about 51 percent of the carbon locked up in tropical vegetation. Africa (28 percent) and Asia (20 percent) followed.
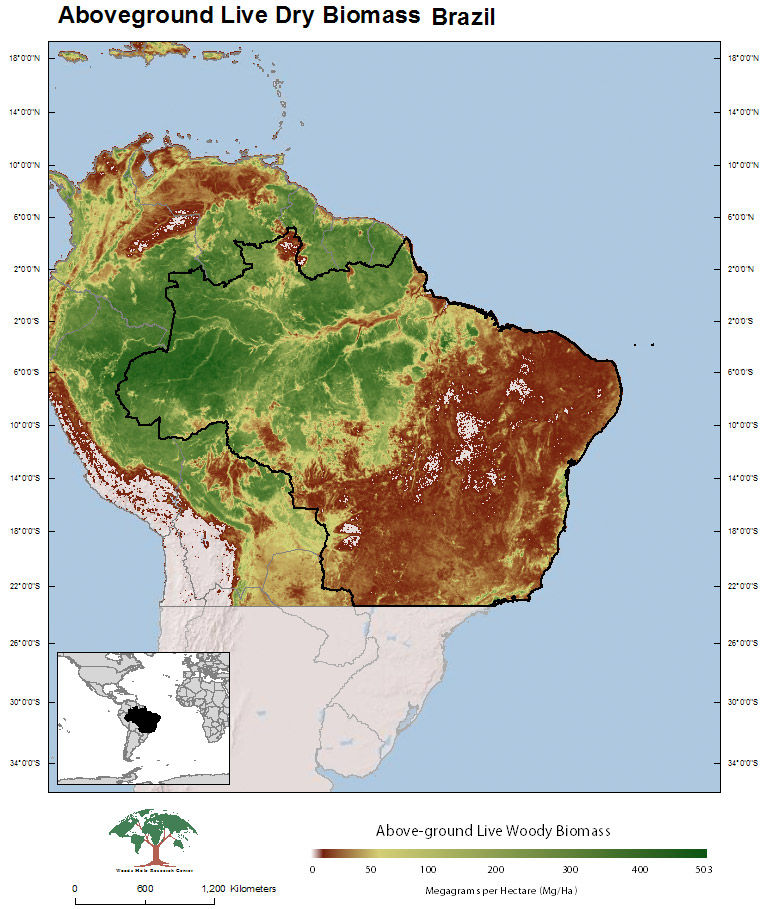 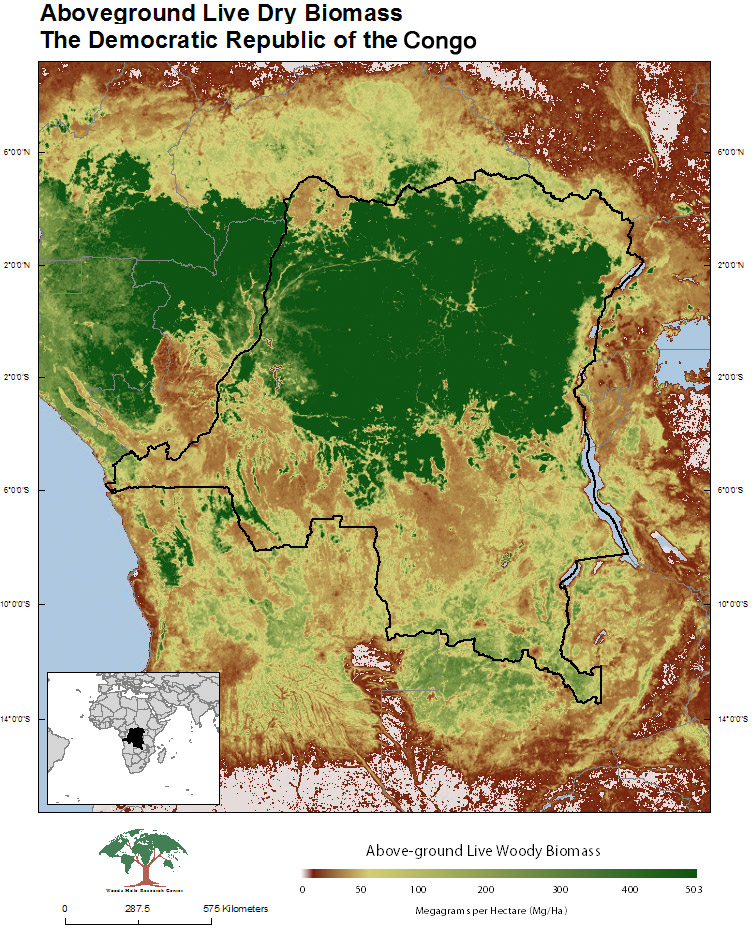 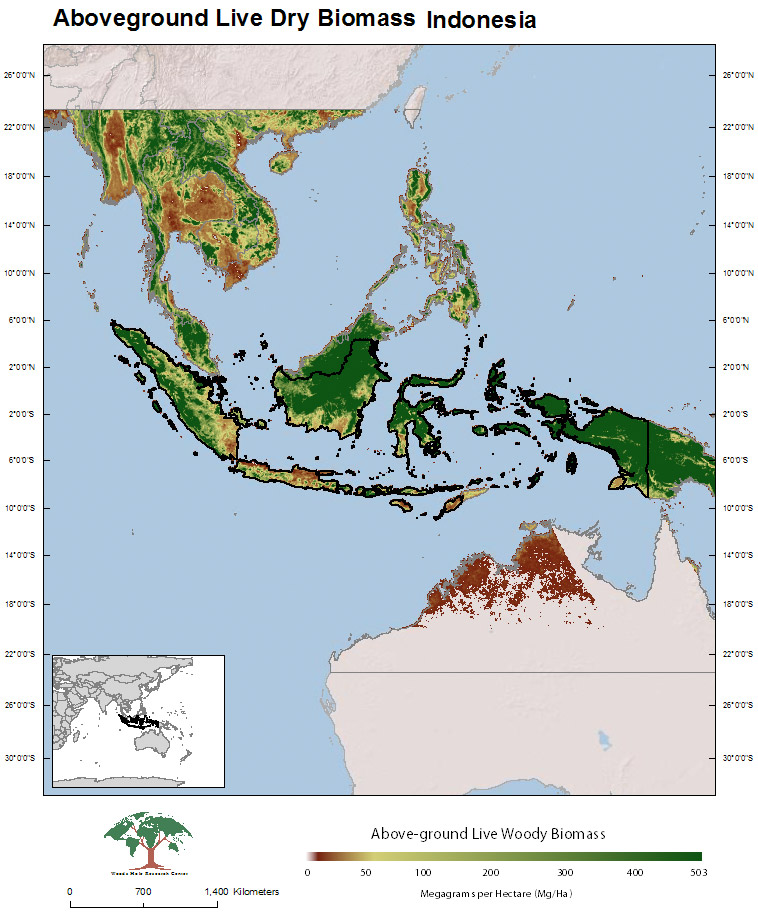 Click images to enlarge |
“For the first time we were able to derive accurate estimates of carbon densities using satellite LiDAR observations in places that have never been measured,” said study lead author Alessandro Baccini of the Woods Hole Research Center (WHRC). “This is like having a consistent, very dense pantropical forest inventory.”
The authors used the data to estimate that net emissions from deforestation from 2000 through 2010 amounted to 1.14 billion tons of carbon per year, suggesting that deforestation accounted for roughly 13 percent of greenhouse gas emissions from industrial sources between 2008 and 2010.
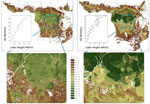
“The paper is important for two reasons,” said co-author and WHRC senior scientist Richard A. Houghton. “First, it provides a high-resolution map of aboveground biomass density for the world’s tropical forests. Previous maps were of much coarser resolution and yielded wildly different estimates of both regional totals and spatial distribution. Second, the paper calculates a new estimate of carbon emissions from land-use change in the tropics.”
Study co-author Scott Goetz, also a scientist at WHRC, added that a study of this nature could have not been done without technological advancements like LiDAR.
“Coupling the Lidar and field measurements is what makes this study and our map so unique, and powerful” he said in a statement. “Without measurements from a satellite-based Lidar, a study of this nature would not have been possible. We need that capability going forward.”
The carbon density data is freely available for download at www.whrc.org/mapping/pantropical/carbon_dataset.html. Satellite processing algorithms and data is posted on the Google Earth Engine.
CITATION: A. Baccini et al (2012). Estimated carbon dioxide emissions from tropical deforestation improved by carbon-density maps. Nature Climate Change doi:10.1038/nclimate1354 Published online 29 January 2012
Related articles
Laser-based forest mapping as accurate for carbon as on-the-ground plot sampling
(11/02/2011) Two new research papers show that an advanced laser-based system for forest monitoring is at least as accurate as traditional plot-based assessments when it comes to measuring carbon in tropical forests.
Breakthrough technology enables 3D mapping of rainforests, tree by tree
(10/24/2011) High above the Amazon rainforest in Peru, a team of scientists and technicians is conducting an ambitious experiment: a biological survey of a never-before-explored tract of remote and inaccessible cloud forest. They are doing so using an advanced system that enables them to map the three-dimensional physical structure of the forest as well as its chemical and optical properties. The scientists hope to determine not only what species may lie below but also how the ecosystem is responding to last year’s drought—the worst ever recorded in the Amazon—as well as help Peru develop a better mechanism for monitoring deforestation and degradation.
(04/13/2009) In October 2008 scientists with the Royal Botanical Garden at Kew discovered a host of previously unknown species in a remote highland forest in Mozambique. The find was no accident: three years earlier, conservationist Julian Bayliss identified the site—Mount Mabu—using Google Earth, a tool that’s rapidly becoming a critical part of conservation efforts around the world. As the discovery in Mozambique suggests, remote sensing is being used for a bewildering array of applications, from monitoring sea ice to detecting deforestation to tracking wildlife. The number of uses grows as the technology matures and becomes more widely available. Google Earth may represent a critical point, bringing the power of remote sensing to the masses and allowing anyone with an Internet connection to attach data to a geographic representation of Earth.
Development of Google Earth a watershed moment for the environment
(03/31/2009) Satellites have long been used to detect and monitor environmental change, but capabilities have vastly improved since the early 1970s when Landsat images were first revealed to the public. Today Google Earth has democratized the availability of satellite imagery, putting high resolution images of the planet within reach of anyone with access to the Internet. In the process, Google Earth has emerged as potent tool for conservation, allowing scientists, activists, and even the general public to create compelling presentations that reach and engage the masses. One of the more prolific developers of Google Earth conservation applications is David Tryse. Neither a scientist nor a formal conservationist, Tryse’s concern for the welfare of the planet led him develop a KML for the Zoological Society of London’s EDGE of Existence program, an initiative to promote awareness of and generating conservation funding for 100 of the world’s rarest species. The KML allows people to surf the planet to see photos of endangered species, information about their habitat, and the threats they face. Tryse has since developed a deforestation tracking application, a KML that highlights hydroelectric threats to Borneo’s rivers, and oil spills and is working on a new tool that will make it even easier for people to create visualizations on Google Earth. Tryse believes the development of Google Earth is a watershed moment for conservation and the environmental movement.
(03/29/2009) Given that deforestation accounts for nearly one fifth of anthropogenic greenhouse gas emissions, reducing forest clearing and degradation is increasingly seen as an critical component to any framework addressing climate change. By some estimates, a mechanism that compensates countries for reducing emissions from deforestation and forest degradation (REDD) could funnel billions of dollars per year towards forest conservation. However the effectiveness of such a mechanism will hinge on the quality of data. Effective mapping and monitoring of forest carbon stores is absolutely key to any mechanism that compensates countries for reducing emissions from deforestation and forest degradation.
Complete map of world forests to help REDD carbon trading initiative
(02/27/2008) Policymakers, conservationists and scientists have high hopes that REDD, a mechanism for compensating countries for reducing emissions from deforestation and forest degradation, will spur a massive flow of funds to tropical countries, helping preserve rainforests and delivering economic benefits to impoverished rural communities. To date, one of the biggest hurdles for the initiative has been establishing a baseline for deforestation rates — in order to compensate countries for “avoided deforestation” it first must be known how much forest the country has been losing on a historical basis. Until now, with some notable exceptions, this data was based largely on spotty satellite assessment and surveys of national forestry departments by the U.N. Food and Agricultural Organization.