308,745,538 people were living in the United States on April 1, 2010, according to the U.S. Census Bureau.
The results represent a 9.7 percent increase since 2000, the smallest decadal increase since the 1930s. Nevertheless, America’s growth rate remains among the highest among wealthy countries, partly a product of immigration.
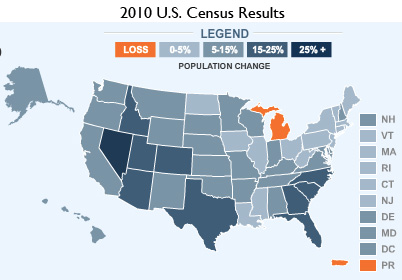
The census found the largest increases in the West (13.8 percent) and the South (14.3 percent). The Midwest and the Northeast grew 3.9 percent and 3.2 percent respectively.
California remained the most populous state, with 37,253,956 people in 2010, although Texas saw the biggest numeric increase since 2000, gaining 4,293,741 people to reach 25,145,561. Nevada saw the biggest percentage gain, rising 35.1% to 2,700,551.
|
Among states, Michigan saw the only decline in population over the past 10 years, falling by 0.6 percent to 9,883,640. Puerto Rico’s population dipped 2.2 percent to 3,725,789.
The census data plays an important role in U.S. politics: it will be used to divide up the 435 seats in the U.S. House of Representatives. Each member of the House represents, on average, about 710,767 people.
The census was the twenty third in the history of the United States. Uncharacteristically for the federal government, the 2010 census came in on time and $1.87 billion under budget.
2010 Census Data (table format)
| AREA | APRIL 1, 2010 | APRIL 1, 2000 | Change | |
| Alabama | 4,779,736 | 4,447,100 | 332,636 | 7.5% |
| Alaska | 710,231 | 626,932 | 83,299 | 13.3% |
| Arizona | 6,392,017 | 5,130,632 | 1,261,385 | 24.6% |
| Arkansas | 2,915,918 | 2,673,400 | 242,518 | 9.1% |
| California | 37,253,956 | 33,871,648 | 3,382,308 | 10.0% |
| Colorado | 5,029,196 | 4,301,261 | 727,935 | 16.9% |
| Connecticut | 3,574,097 | 3,405,565 | 168,532 | 4.9% |
| Delaware | 897,934 | 783,600 | 114,334 | 14.6% |
| District of Columbia | 601,723 | 572,059 | 29,664 | 5.2% |
| Florida | 18,801,310 | 15,982,378 | 2,818,932 | 17.6% |
| Georgia | 9,687,653 | 8,186,453 | 1,501,200 | 18.3% |
| Hawaii | 1,360,301 | 1,211,537 | 148,764 | 12.3% |
| Idaho | 1,567,582 | 1,293,953 | 273,629 | 21.1% |
| Illinois | 12,830,632 | 12,419,293 | 411,339 | 3.3% |
| Indiana | 6,483,802 | 6,080,485 | 403,317 | 6.6% |
| Iowa | 3,046,355 | 2,926,324 | 120,031 | 4.1% |
| Kansas | 2,853,118 | 2,688,418 | 164,700 | 6.1% |
| Kentucky | 4,339,367 | 4,041,769 | 297,598 | 7.4% |
| Louisiana | 4,533,372 | 4,468,976 | 64,396 | 1.4% |
| Maine | 1,328,361 | 1,274,923 | 53,438 | 4.2% |
| Maryland | 5,773,552 | 5,296,486 | 477,066 | 9.0% |
| Massachusetts | 6,547,629 | 6,349,097 | 198,532 | 3.1% |
| Michigan | 9,883,640 | 9,938,444 | -54,804 | -0.6% |
| Minnesota | 5,303,925 | 4,919,479 | 384,446 | 7.8% |
| Mississippi | 2,967,297 | 2,844,658 | 122,639 | 4.3% |
| Missouri | 5,988,927 | 5,595,211 | 393,716 | 7.0% |
| Montana | 989,415 | 902,195 | 87,220 | 9.7% |
| Nebraska | 1,826,341 | 1,711,263 | 115,078 | 6.7% |
| Nevada | 2,700,551 | 1,998,257 | 702,294 | 35.1% |
| New Hampshire | 1,316,470 | 1,235,786 | 80,684 | 6.5% |
| New Jersey | 8,791,894 | 8,414,350 | 377,544 | 4.5% |
| New Mexico | 2,059,179 | 1,819,046 | 240,133 | 13.2% |
| New York | 19,378,102 | 18,976,457 | 401,645 | 2.1% |
| North Carolina | 9,535,483 | 8,049,313 | 1,486,170 | 18.5% |
| North Dakota | 672,591 | 642,200 | 30,391 | 4.7% |
| Ohio | 11,536,504 | 11,353,140 | 183,364 | 1.6% |
| Oklahoma | 3,751,351 | 3,450,654 | 300,697 | 8.7% |
| Oregon | 3,831,074 | 3,421,399 | 409,675 | 12.0% |
| Pennsylvania | 12,702,379 | 12,281,054 | 421,325 | 3.4% |
| Rhode Island | 1,052,567 | 1,048,319 | 4,248 | 0.4% |
| South Carolina | 4,625,364 | 4,012,012 | 613,352 | 15.3% |
| South Dakota | 814,180 | 754,844 | 59,336 | 7.9% |
| Tennessee | 6,346,105 | 5,689,283 | 656,822 | 11.5% |
| Texas | 25,145,561 | 20,851,820 | 4,293,741 | 20.6% |
| Utah | 2,763,885 | 2,233,169 | 530,716 | 23.8% |
| Vermont | 625,741 | 608,827 | 16,914 | 2.8% |
| Virginia | 8,001,024 | 7,078,515 | 922,509 | 13.0% |
| Washington | 6,724,540 | 5,894,121 | 830,419 | 14.1% |
| West Virginia | 1,852,994 | 1,808,344 | 44,650 | 2.5% |
| Wisconsin | 5,686,986 | 5,363,675 | 323,311 | 6.0% |
| Wyoming | 563,626 | 493,782 | 69,844 | 14.1% |
| 0 | #DIV/0! | |||
| TOTAL | 308,745,538 | 281,421,906 | 27,323,632 | 9.7% |
| 0 | #DIV/0! | |||
| Northeast | 55,317,240 | 53,594,378 | 1,722,862 | 3.2% |
| Midwest | 66,927,001 | 64,392,776 | 2,534,225 | 3.9% |
| South | 114,555,744 | 100,236,820 | 14,318,924 | 14.3% |
| West | 71,945,553 | 63,197,932 | 8,747,621 | 13.8% |
| 0 | #DIV/0! | |||
| Puerto Rico | 3,725,789 | 3,808,610 | -82,821 | -2.2% |