An interview with Dr. Matt Hansen, co-director of SDSU’s Geographic Information Science Center of Excellence
In recent years there has been an explosion in the number of satellite-based monitoring applications and technologies, which is perhaps best exemplified in the eyes of the public by Google Earth, which allows anyone with a decent internet connection to view overhead images of nearly any place on Earth. But these new applications are also helping scientists more effectively monitor environmental change, including the fluctuations in polar sea ice, shifts in oceanic plankton, and deforestation. An important factor in the expanded use of satellite imagery has been the U.S. government’s free Landsat Data Distribution Policy, which allows free or inexpensive access to data captured by Landsat satellites, which have been collected data on a regular basis since 1972. To date, the Landsat program has accumulated more 630 terabytes of data in its archive, which is growing by more than 320 gigabytes per day.
But the Landsat program is not presently operating at its full capacity. Two satellites remain in orbit: Landsat 5, which is operating more than two decades beyond its original 3-year mission, and Landsat 7, which suffered a malfunction in 2003 that degrades some data but still continues to provide critical data. Remote sensing scientists are therefore looking forward to 2012, when Landsat Data Continuity Mission launches. That initiative will “collect and archive data consistent with its predecessor Landsat satellites”, according to NASA. Should the satellites fail in the interim, scientists will face a “data gap” in their research efforts.
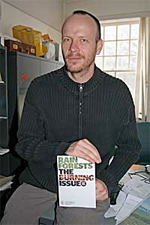 Matt Hansen. Photo courtesy of SDSU. |
Continuity is crucial. Landsat is particularly important to researchers monitoring changes in forest cover, especially when trying to construct a historical baseline. Matthew Hansen, a remote sensing scientist at South Dakota State University and one of the world’s leading experts on tracking deforestation, says that the number of “observations” or images captured, rather than the algorithms and computing power to process and analyze data, is now the biggest limiting factor in efforts to accurately measure deforestation in a timely matter.
Hansen says that while surging interest in forest conservation is driving new investment—from both governments and the private sector—in remote monitoring systems, Landsat remains important because at the end of the day, “almost everybody looking at large areas of land is using Landsat because it is cheaper and systematically acquired,” especially when constructing historical baselines needed for the Reducing Emissions from Deforestation and Degradation (REDD) program, which offers the potential to compensation tropical countries for protecting and sustainably managing their forests.
Hansen discussed how he uses Landsat and other systems for detecting deforestation during a May interview with mongabay.com’s Rhett Butler.
AN INTERVIEW WITH MATT HANSEN
mongabay.com: What is your background and how did you get interested in doing what you do now?
Matthew Hansen: Yes, I got my undergraduate degree in Electrical Engineering; but I didn’t really like that so much I went to raise fish in the Peace Corps in what was then Zaire. After that I came back and I did a Masters in Geography. I didn’t know what I wanted in Geography but when I came back from the Peace Corps, I knew I liked math and I saw spatial as a fantastic concept in that you could look at huge areas in a purely consistent way.
My first position, before I even got my PhD, was working with global scale land covering analysis at the University of Maryland. And when I got there they had just finished the 1° map: 365 x 180 pixels of the earth. 1° then was a big deal! And during my stay there – I was ten years there – we went quickly down to 8 kilometers, 1 kilometer, 500 meters, and 250 meters. Now our goal now is to get down to 30 meters in a global monitoring scheme.
So it is fairly cool, if you like math!
mongabay.com: Yes. It is amazing how much progress has been made in terms of high resolution. Has improved availability of data been an important factor?
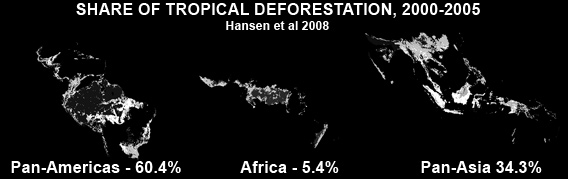
 Global forest cover loss by biome, 2000-2005. Chart by Rhett A. Butler / mongabay.com. Click to enlarge. |
Matthew Hansen: The bummer is really that we had this horrible data policy for using Landsat back when it was privatized. It used to be that it was one image was $2000. This really held the science back. But now we process thousands of images and, you know, we are going to start using cloud computing, which will greatly speed things up but will start to run up against the limitations of the Landsat. We already know the conceptual limitations of Landsat, but now that we can look at every pixel from the archive, essentially, we will understand these much better. We could have understood this 10, 15, or 20 years ago, but because of data policy we didn’t. Having had that policy really delayed our understanding but hen it was opened up a little over a year and four months ago, it greatly increased the capacity for remote sensing applications.
mongabay.com: So now that it is open, can all that old data can be utilized?
Matthew Hansen: To a degree. There are different systems and they still have to build up the automated system for processing the images from the 70s. But all the TM data is there.
Still the archive has been inconsistent if you go back. For example there are no images of Siberia from the early 90s. It is uneven coverage. So it is not like we are going to be able to systematically reconstruct the history, but we will do okay.
mongabay.com: But there is potential to reconstruct more history, in terms of forestry, than we have now.
Matthew Hansen: Oh yes! No question – absolutely! But we just don’t know where we will come up empty in terms of data. Going forward however there will be good data. It may not be always online but you can order it. So our latency for products is going to improve very much. We are not going to be so far behind.
mongabay.com: Are you working or planning to work with data from non-optical sensors? I mean going beyond Landsat to things like LIDAR?
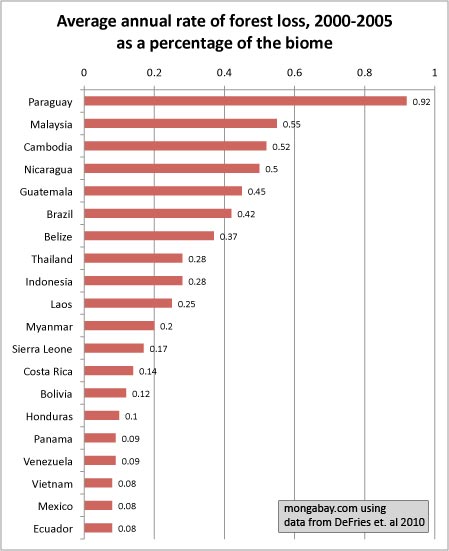 Average annual rate of forest loss, 2000-2005 as a percentage of the original extent of the biome (rather than the extent of forest in 2000). Click image to enlarge. |
Matthew Hansen: We started with AVHR and then we moved to MODIS, which works really nicely in conjunction with Landsat. I think the future is fusion. We‘ve testing with Landsat and GLAS data, the LIDAR that was on the IceSat that was designed for monitoring ice. The future is going to be really creative, leveraging different sources of information and combining them: MODIS, Landsat, LIDAR. We are going to have to use them all together.
The key is that these systems have global acquisition strategies. They have to have easy and free access to data. And any time they try to commercialize it or something it greatly increases the cost of environmental monitoring.
So MODIS and Landsat have big acquisition strategies. They are not the best but the data are free.
And you know, we propose that the value is in the applications – not in selling data little bit by little bit. And also, if you want to have true climate monitoring or REDD, then you have just got to have the data. You can’t just sit there and say, “Well I’ve got a data buy from SPOT for years and years for my REDD project.” What about the ten years before? What about the ten years after that? You just have to have the data kind of going down the pipe regularly, without asking for it.
That is kind of what I think all this stuff, especially with REDD, is going to have to happen. Because if a country like Cambodia wants to do something similar to what Guyana is doing, but lacks the commercial data set Guyana is using, then you have got a deal breaker right there.
Think about the engineers in the 1960s who conceived of Landsat and you can argue that, yes, sure, we have improved some of the engineering of Landsat and whatever as we have gone over time – but it is still the same. It is the same thing! We are still using a single Landsat after 30 or 40 years! I mean, why don’t we have five of these? We get the picture every 16 days of the Congo and 70% of them are cloudy!
What if you had different crossing times – in other words different acquisition times – and also more of them? Then we could image the world at 10 meters every day? That would be cool! This is dreaming, but boy, we could have daily land reports by using one of these things.
I think that is where we need to go.
mongabay.com: Do you think that if REDD becomes a reality and there is a lot of money going into that sector, that would drive deforestation-specific satellites? Or at least more sensors geared towards detecting deforestation and degradation? What do you see this happening in the near future in terms of having more capacity?
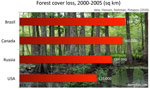
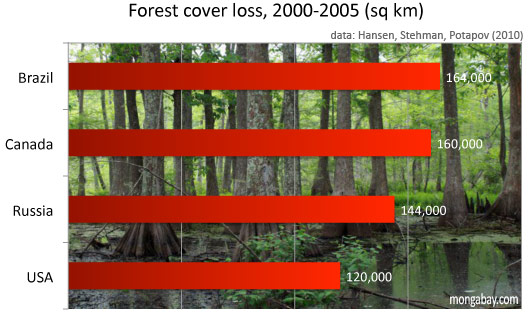 Total forest loss (natural and deforestation) for the United States, China, Brazil, and Russia, 2000-2005. Chart by Rhett A. Butler / mongabay.com. Click to enlarge. |
Matthew Hansen: One of the things with REDD is that you have so much money and so many people want to make money off of it, there could be a commercial model. But then we go back to the pitfalls of a commercial model.
But I am not a policy guy or an economist. I really don’t know how this will play out. But I can just imagine that if companies throw a bunch of money in it, they will say, “Now we’ve got a cost model and we are not going to make the data free. We are going to retrench and try to turn this into a profit-making scheme that we never could before.”
But again if you look very narrowly at the issue, that might work. If you look at the bigger objective, which is kind of generic, global scale, or even only tropical-scale, which everyone will access—one of the basic assumptions of REDD—I argue this kind of commercial model would fail horribly.
I can certainly imagine people trying to push it. But I think the value is in the applications—whoever can stand up and deliver the data everywhere, will provide the value. Let me give another example: Landsat has been far cheaper and regularly acquired than SPOT, even though it hasn’t been free to now. But if you look at the Europeans, their basic land cover maps are made from Landsat, even though SPOT is sitting right there [SPOT is an initiative of the European Space Agency]. SPOT imagery is more costly and therefore tougher to use that data. So almost everybody looking at large areas of land is using Landsat because it is cheaper and systematically acquired.
mongabay.com: Is ESA’s system primarily the result of a policy issue?
Matthew Hansen: That is a policy issue. SPOT is a private entity and their data are just harder to get hold of. SPOT’s sharing policies aren’t conducive to research—if you buy an image, you don’t get to share it after that, whereas Landsat has always been if you buy it once then you can share it with everybody. These at least were the policies—I’m not sure what they are currently. But with their new Sentinel series, SPOT says they are changing that. The Sentinel suite of satellites will have radar, Landsat-like instruments, and a couple of other things that will be free and open. So that is cool! That may push others to be that way.
mongabay.com: What about ALOS?
Matthew Hansen: ALOS is the closest thing in the radar domain in terms of having progressive ideas of accessible data but there is still a cost associated with it.
MODIS and Landsat are the most accessible in terms of medium resolution data out there. SPOT vegetation is freely available but the resolution is 1-kilometer.
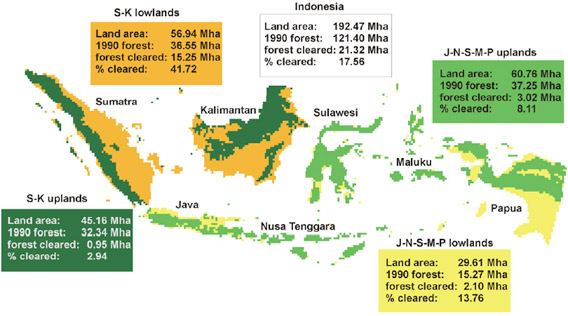
Estimates of national and sub-national forest cover extent and loss. S-K stands for the combined Sumatra and Kalimantan island
groups. J-N-S-M-P stands for the combined Java, Nusa Tenggara, Sulawesi, Maluku and Papua island groups. Image courtesy of Hansen et. al. 2009.
mongabay.com: For something like REDD, Landsat also provides the historical record.
Matthew Hansen: Yes that’s right. Especially when you establish the 1990s, say, as the baseline.
We have a 1990s preliminary result for the humid tropics.
And we have a 2002-2005. And this summer we will do 2005-2007. But this series 2000-2005 will all be dealing with humid tropics—like rainforests
|
mongabay.com: So what are some of the things you are learning about drivers of deforestation over your study period?
Matthew Hansen: We use a probability-based process, with sample blocks in the humid tropics. We haven’t looking specifically at clearing size—the scaling corrector off data problem resulting from the Landsat malfunction back in 2003—but it is a great question. Using a probability-based sample for the humid tropics, we could determine what percentage of clearing is for the “big stuff”: agroindustry feeding the global marketplace. We would be able to see the kind of changes tied to agroindistry, rather than swidden agriculutralists.
mongabay.com: You touched on that issue in a recent paper with Tom Rudel and Ruth DeFries: that there has been a shift from smaller scale deforestation to the more intensified industrial deforestation where giant areas of land are being cleared for plantations, pasture, and mechanized farms.
Matthew Hansen: Yes that’s right. We found this to be the trend in Brazil, Paraguay, Argentina, Malaysia, and Indonesia. The scale of disturbance is amazing. But we don’t see that in Africa—at least not yet.
mongabay.com: So looking at Southeast Asia – Indonesia and Malaysia and perhaps even beyond – what have you seen in terms of the differences between say the 1990s and the 2000-2005 period?
Matthew Hansen: Well, Indonesia our story is an interesting one that I don’t think is going to surprise people. The ‘90s were just unbelievable with the 1997-1998 fires as well as a very strong commitment by the central government and the forestry sector to really go after the lowland forest for developing oil palm plantations.
But then as the ’90s closed you had this big economic upheaval and in fact, Suharto was forced out of power. In our MODIS signal we see a low change at the turn of the century and then a gradual increase. In the aggregate – let’s say in the 2000-2005 – the mean is lower than the 90s. So it is kind of like a big hangover related to the economic and political upheaval.
But then deforestation starts going back up, climbing to over a million hectares per year by the middle of this decade.
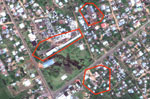
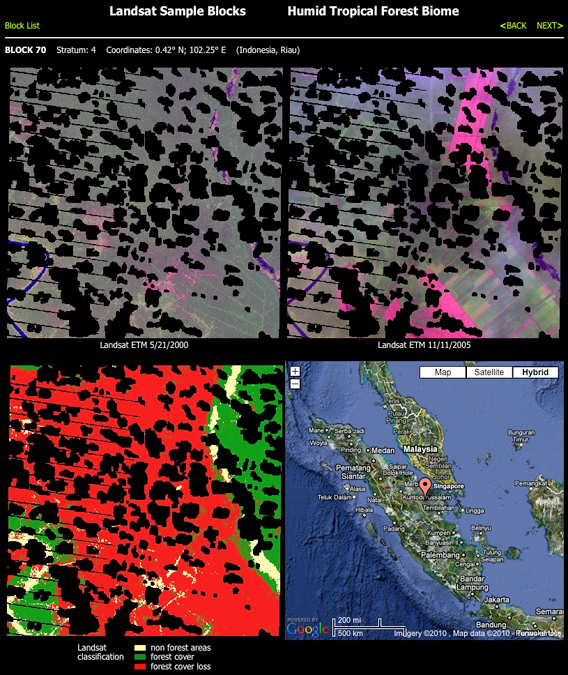 Landsat Sample Block for Riau, Indonesia (Coordinates: 0.42° N; 102.25° E). The image on left was captured by Landsat on 5/21/2000, while the image on the right was captured 11/11/2005. The image in the lower right shows land cover change, with red reflecting forest loss. |
Detecting deforestation in Indonesia is very different than Brazil, where you have a cloud-free window every year [July-August], which gives you a good annual trend. Clouds in Indonesia make it difficult to do that in Indonesia so we have to use MODIS to get coarser rates of change. We use Landsat to bracket a period. So we will get the change of 200-2005 and then we will disaggregate it annually by MODIS.
But at some point in some of these places – like Sumatra – they are kind of exhausting the lowland forest. One of our estimates is like from 1990 to 2005, show a huge proportion of lowland forests in Sumatra were cleared. That means you literally are going to run out of lowland forest. We are seeing up clearing upland areas—hills—now in Sumatra.
But it is complicated and it is hard to tell the story. For example, Malaysia doesn’t follow the same trend. I can’t tell you exactly what are results are for Malaysia, but so far we don’t have the same “fall off a cliff” stopping of logging that we see in Indonesia. It has been pretty consistent since 2000.

|
mongabay.com: And are you able to distinguish between oil palm plantations and natural forest when you are doing the sensing?
Matthew Hansen: We don’t try to include palm dynamics in these numbers typically because a mature timber plantation isn’t going to be distinguished from natural forest. We basically use one definition for “forest.” We are working towards getting more in the time domain, so when we are working in a place like Indonesia, eventually, with Landsat data, we will know the time cycles of palm and timber plantations, and we will have the history of that pixel so we will know that it was cleared in 2000, and then re-cleared again in 2010 – or whatever their cycle is. And then, you know, the impact be mapped. Right now, our history has been to look at an image and say “I need to map this.” But we need pixel histories. That will be the thing that will help us to disaggregate a lot of this land use. But right now, I cannot in an automated way differentiate between mature palm and forest.
If we just focus on Sumatra, I am pretty sure we can map the timber plantations from the palm estates, from the older growth, from the degraded old growth.
But Indonesia is a much harder place to work in than Brazil. It is very cloudy, the topography is rough, and, after logging, the forest comes back in some other form. It is just really different than Brazil. And it is sad because there is a lot of critical forest being lost in Sumatra and Kalimantan.
mongabay.com: The pixel history still won’t deal with the cloud issue, right?
Matthew Hansen: Well, yes. The cloud issue just means how frequently we are going to be able to say things with confidence. So if we get a bad image, am I going to be able to say all the stuff that we are talking about? No. How many images am I going to need? How many observations per land pixel are we are going to need to tell you these things. That is the question and I am not really sure how long it will take.
This issue takes us back to the limitation of having one Landsat—which isn’t even fully functional. One Landsat is insufficient for really rapid updating of these dynamics.
mongabay.com: What about Congo? What have you found there in terms of dynamics?
Matthew Hansen: You can see the impact of political instability and war in the Congo even from space. Like Angola and Mozambique in the 1980s and 1990s, war left essentially isolated Congo from the global economy. Structurally the woodlands of these countries were largely left alone during these long periods of intense civil strife.
In the Congo—compared to Malaysia, Indonesian and Brazil, which are stable democratic market economies—they are so wired with the rest of the world, and they have industrial-scale investment, which transforms forests for large-scale logging and agriculture. Cargill is not building ports or infrastructure in the Congo Basin. It would be hard to do anyway – it is kind of unfriendly terrain. But if there was political stability there, sure, there would be a ton more infrastructure and more development going on. You are already starting to hear hints about big agricultural projects, including companies from China and South Africa looking at palm and soybeans.
The conversion of forest in the Congo is almost entirely done by small farmers. It’s spatially pervasive—like a contagion along all the logging roads. It’s like a moth-eaten edge going into the forest. That’s the primary dynamic.
The other big activity is selective logging, which is not a capital-intensive investment and doesn’t leave much of a signature—spatially—on the forest. The loggers build their roads, log their trees, and then get out. But the impact can be huge on biodiversity since these companies attract workers who hunt wildlife in the forest and the roads provide access for settlers. So you see villages popping up where there were never villages before. But aside from these effects, after the companies pull out, the area is still forest. With Landsat you can’t see the one tree per hectare they are pulling out of the forest in the northern Republic of Congo—especially with all the clouds.
So there’s a very different level of intensity in terms of modifying the structure of the forest in the Congo Basin compared to the other places like Brazil and Indonesia where you have industrial-scale agriculture and ranching moving in after logging. In Sumatra you have to look really hard to find a forest that hasn’t been messed with—and it be high in the hills, typically.
mongabay.com: Are you able to pick up the logging roads with Landsat?
Matthew Hansen: Yes, they make some pretty big logging roads in the Congo. They make them wide so they get some sun and stay dry. You have to catch when they are first built because then the re-growth obscures them.
We just flew over a 15-year-old concession in the Republic of Congo and you could still see the logging roads from space—a very bright contrast to the surrounding forest. But the single species tree plantation that had grown up along side the fifty kilometers of road was barely distinguishable from the old growth forest. It was maybe only a meter shorter. The logging road is now the only signal of the conversion.
mongabay.com: But if you have that pixel history, then you will know that that area was deforested and now it is either regenerating forest or plantation, right?
Matthew Hansen: Yes, exactly.
mongabay.com: What is your methodology for forest mapping in terms? You seem to do a lot of sampling.
Matthew Hansen: We don’t just do sampling: we map the Congo Basin wall-to-wall and we have mapped Kalimantan and Sumatra wall to wall. The reason we started with the sampling is the archive wasn’t open yet when we began the study.
We have MODIS data we can map globally. MODIS can indicate where tree is being lost and we can stratify and make a sampling scheme to go down and grab some Landsat images. But even with the archive open there is an argument for sampling, because it is fast and it is pretty accurate. You also get enough certainty measure around it, which you don’t necessarily get with the map. The map is a weird thing;–you need to do some intense validation to figure out errors in your map.
But it’s a tradeoff. With sampling you don’t get a map, but an estimate over an area.
Almost all of our effort now is in wall-to-wall mapping based an exhaustive mining of the archive where we have 7000 images over Kalimantan and Sumatra from 2000 to 2009. We’ve automated all of the e cloud flagging and shadow flagging to define whether or not the forest was changed. This stuff is pretty cool. There is a new science to be able to figure out how to handle all these uneven distributions of observations. But it is pretty solid.
The technical challenge is maintaining the accuracy when scaling from a small sample to a country-wide assessment. So while the characterization of a small square might work fine, when extended over an entire country using an automated process, you may problems. Especially if you move outside a region where land use dynamics might change. For example if I do a global Landsat product, I might lose something.
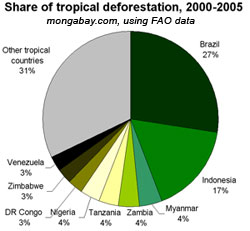
mongabay.com: What about varying definitions of what constitutes forest? Does this cause problems? In your recent publication, you seem to take a much more strict definition of forest cover than, say, the FAO does. Is that because this is just more in line with the sort of data you are using?
Matthew Hansen: FAO has come up with something like 850 different definitions of “forest”. If they don’t use a threshold of 10 percent then a place like Kazakhstan doesn’t have any forest.
I don’t know if their definition is really based on the biophysical representation of “forest” or whether it’s more political.
|
On the same token, we have a certain motivation as well: we want to map something that we can see from space consistently over time. And you have a 10 percent tree cover definition then most of your signal is the background—soil or whatever—which can complicate the picture. For example, Australia right now is fighting to meet FAO’s definition. Australia is confident it can map at least 20 or 25% tree cover pretty easily with a standard simple approach; but to get down to 10% they are killing themselves with all kinds of testing of textures and things. And they still don’t have anything proven. So technically speaking, 10 percent is very difficult.
The other issue relates to the application. If you are talking carbon and use a forest definition of 2 meters, then all of Botswana is forest. If you have 10 percent tree cover at 2 meters then Jakarta is a forest at that stage!
I don’t know what the best answer is but we stick with the figure that we can reproduce over time—5 meter high vegetation with 25 percent or greater cover. We can reliably report dynamics with that definition.
mongabay.com: Your recent paper on global forest cover loss stirred up some strong responses, especially in temperate forest countries. How do you respond to the criticism that global forest cover loss doesn’t account for regrowth and industrial forest management practices?
Matthew Hansen: Yes foresters hate this. They hate it, yes! Forests ask, ”Why are you even saying that forest cover is changing?” They maintain it is a zero net change kind of place where forest is cut down and replanted.
It is not the same changes as what is occurring in Brazil. But I am sure those rates of change over time windows vary with good economics and bad economics: they will cut more forest in Canada if we built a lot more houses down here in the United States. But foresters will always maintain that it is sustainable because they replant trees. And so they never report to FAO any change in their forest area: it is always zero.
There are forest maps for every other places in the world, but “nothing going on” in Canada and the U.S. Kind of strange.
So we can quibble about this stuff – but we just need to look at the reality: Where are the trees? Where were the trees? And where were they not? That’s it. And you can say it is sustainable – you can say whatever.
mongabay.com: But in the boreal region, both the US and Canada, there has been a lot of change that isn’t necessary the product of direct deforestation and logging.
Matthew Hansen: That’s right. Fires and beetles leave a strong signal.
mongabay.com: Is it easy to distinguish between what has been caused by fire and what has been caused by beetles?
Matthew Hansen: Well, again we look at it all together. But we did a side study, where we just aggregated the fire portion, which accounts for 60 percent. The question then becomes, “Is all that fire natural?” The Canadians will say “Yes, it’s all natural.” But in Russia, it’s clearly not. In the Far East there are a lot of fires being set by humans.
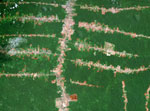
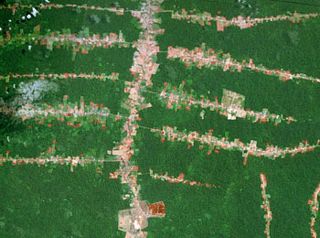 ‘Fishbone’ deforestation patterns in the Brazilian Amazon in 2006. 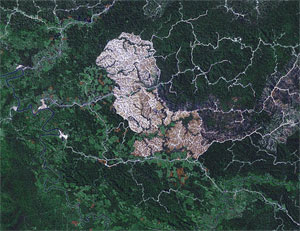 Deforestation for oil palm plantation development in Sarawak, Malaysia in 2006.
|
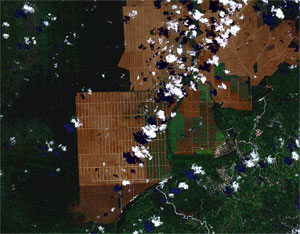 Deforestation for oil palm plantations in Sarawak, Malaysian Borneo in 2006. All images courtesy of NASA.
The next question is “What are the trends in those types of dynamics?” Even though the beetles and the fires are natural, they are at least partly driven by climate change. The beetle problem has to do with the minimal temperature during the winter being too warm and not killing them back, thereby holding them in check. They are endemic to that region, but the fact that Canada has warmer winters may be the reason beetles have spread.
Higher temperatures mean that fire dynamics can change too. And I am not saying that it has or not – but one of the points is that is that if we were to do this study repeatedly over time, and follow trends in fire or disease, we would know whether these in the end could be tied back to an underlying human cause. We need the observations though.
mongabay.com: What needs to happen to make this whole system work better so we can have a better idea of what is happening with forests around the world?
Matthew Hansen: One of the most important things is observations—imagery. We need more observations.
I think the first thing is that these open archives will lead to a lot of generic understanding. There is no question we will be able to do ample samples with that scale kind of products over 3-5 year periods, and this will be very cool. I think we will make huge progress in addressing some of that issue of generic kind of overview; understanding of relative rates of change.
But if you really want to dig down to the time intervals that have more meaning; if you want to have more rapid updates; better, more accurate products, you need more high-quality observations.
So that means constellations of similar sensors. You know, Landsat is not very good at a lot the selective logging—what you need for that is a resolution of less than ten meters, done daily. That capability would just be fantastic! We would be able to understand so much more if we had that kind of observational frequency and quality regarding disturbance.
I think the algorithms and the computing power we have now are sufficient. We will be ready to handle those types of data sets.
A selection of Hansen’s papers referenced in this interivew (see below for related stories)
- Hansen, Matthew C.; Stehman, Stephen V.; and Potapov, Peter V. Quantification of global gross forest cover loss. PNAS. www.pnas.org/cgi/doi/10.1073/pnas.0912668107.
- Matthew C. Hansen at al. (2008). Humid tropical forest clearing from 2000 to 2005 quantified by using multitemporal and multiresolution remotely sensed data. PNAS July 8, 2008 vol. 105 no. 27 9439-9444.
- Ruth S. DeFries, Thomas Rudel, Maria Uriarte and Matthew Hansen. Deforestation driven by urban population growth and agricultural trade in the twenty-first century. Nature Geoscience. published online: 7 February 2010 | DOI: 10.1038/NGEO756
- Matthew C Hansen, Stephen V Stehman, Peter V Potapov, Belinda Arunarwati, Fred Stolle and Kyle Pittman (2009). Quantifying changes in the rates of forest clearing in Indonesia from 1990 to 2005 using remotely sensed data sets. ENVIRONMENTAL RESEARCH LETTERS. Online at stacks.iop.org/ERL/4/034001
Related articles
United States has higher percentage of forest loss than Brazil
(04/26/2010) Forests continue to decline worldwide, according to a new study in the Proceedings of the National Academy of Science (PNAS). Employing satellite imagery researchers found that over a million square kilometers of forest were lost around the world between 2000 and 2005. This represents a 3.1 percent loss of total forest as estimated from 2000. Yet the study reveals some surprises: including the fact that from 2000 to 2005 both the United States and Canada had higher percentages of forest loss than even Brazil.
Rainforest destruction becomes industry-driven, concentrated geographically
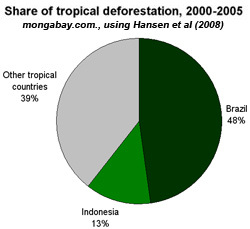
(06/30/2008) New analysis of global deforestation reveals that the bulk of tropical forest loss is occurring in a small number of countries. The research — published in the journal Proceedings of the National Academy of Sciences (PNAS) — shows that Brazil accounts for nearly half of global deforestation, nearly four times that of the next highest country, Indonesia, which makes up about an eighth of worldwide forest clearing.
Satellites being used to track illegal logging, rosewood trafficking in Madagascar
(01/28/2010) Analysts in Europe and the United States are using high resolution satellite imagery to identify and track shipments of timber illegally logged from rainforest parks in Madagascar. The images could be used to help prosecute traders involved in trafficking and put pressure on companies using rosewood from Madagascar.
Google’s Earth Engine to help tropical countries monitor forests
(12/16/2009) A powerful forest monitoring application unveiled last week by Google will be made freely available to developing countries as a means to build the capacity to quality for compensation under REDD, a proposed climate change mitigation mechanism that would pay tropical countries for protecting forests, according to a senior Google engineer presenting at a side event at COP15 in Copenhagen.
40% of lowland forests in Sumatra and Indonesian Borneo cleared in 15 years
(11/10/2009) Forty percent of lowland forests in Sumatra and Kalimantan (Indonesian Borneo) were cleared from 1990 to 2005, reports a new high resolution assessment of land cover change in Indonesia.
How satellites are used in conservation
(04/13/2009) In October 2008 scientists with the Royal Botanical Garden at Kew discovered a host of previously unknown species in a remote highland forest in Mozambique. The find was no accident: three years earlier, conservationist Julian Bayliss identified the site—Mount Mabu—using Google Earth, a tool that’s rapidly becoming a critical part of conservation efforts around the world. As the discovery in Mozambique suggests, remote sensing is being used for a bewildering array of applications, from monitoring sea ice to detecting deforestation to tracking wildlife. The number of uses grows as the technology matures and becomes more widely available. Google Earth may represent a critical point, bringing the power of remote sensing to the masses and allowing anyone with an Internet connection to attach data to a geographic representation of Earth.
Rainforest destruction becomes industry-driven, concentrated geographically
(06/30/2008) New analysis of global deforestation reveals that the bulk of tropical forest loss is occurring in a small number of countries. The research — published in the journal Proceedings of the National Academy of Sciences (PNAS) — shows that Brazil accounts for nearly half of global deforestation, nearly four times that of the next highest country, Indonesia, which makes up about an eighth of worldwide forest clearing.