- In October 2008 scientists with the Royal Botanical Garden at Kew discovered a host of previously unknown species in a remote highland forest in Mozambique.
- The find was no accident: three years earlier, conservationist Julian Bayliss identified the site—Mount Mabu—using Google Earth, a tool that’s rapidly becoming a critical part of conservation efforts around the world.
- As the discovery in Mozambique suggests, remote sensing is being used for a bewildering array of applications, from monitoring sea ice to detecting deforestation to tracking wildlife.
A condensed version of this post originally appeared at Yale e360.
In October 2008 scientists with the Royal Botanical Garden at Kew discovered a host of previously unknown species in a remote highland forest in Mozambique. The find was no accident: three years earlier, conservationist Julian Bayliss identified the site—Mount Mabu—using Google Earth, a tool that’s rapidly becoming a critical part of conservation efforts around the world.
As the discovery in Mozambique suggests, remote sensing is being used for a bewildering array of applications, from monitoring sea ice to detecting deforestation to tracking wildlife. The number of uses grows as the technology matures and becomes more widely available. Google Earth may represent a critical point, bringing the power of remote sensing to the masses and allowing anyone with an Internet connection to attach data to a geographic representation of Earth.
Brief history of remote sensing for environmental applications
A lot of environmental monitoring is possible today only through remote sensing. Detecting changes in sea ice across the sub-freezing Arctic is one example, but remote sensing also allows monitoring of hostile and sometimes war-torn deserts, vast expanses of ocean, the dense Amazon rainforest, and isolated mountain ranges—monitoring which would be cost-prohibitive or impossible without eyes from above.
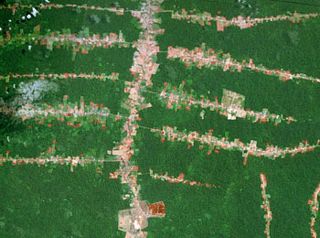 Landsat image revealing “fishbone” deforestation along roads in the Brazilian Amazon |
“Sending people in by foot to survey these places is costly, time-consuming, and potentially dangerous,” Ruth DeFries, a GIS specialist at Columbia University, told mongabay.com. DeFries authored a comprehensive review last year on the use of remote sensing for terrestrial environmental monitoring. “Remote sensing is really the only way to do this work.” she said.
Early earth observation satellites focused on weather, but scientists quickly devised ways to use their data to analyze vegetation cover. In 1972 Landsat became the first non-weather satellite for civilian use, giving scientists the ability to observe any place on Earth every 18 days. The satellite initially was used for crop analysis but today, seven satellite generations later, higher resolution and additional spectral bands have vastly expanded Landsat’s functionality for a wide array of applications.
Since the 1990s, Landsat has become only one example of many sensing technologies. Landsat 7, the most recent Landsat satellite, carries several passive sensors using different wavelengths to decipher Earth’s features from above. A passive optical sensor, for example, is much like a camera, operating off visible light reflected from Earth’s surface. This reliance has its shortcomings—notably it will only take pictures of what it can see. Clouds, smoke, and other factors can interfere with or block its sensing capabilities. Meanwhile, infrared detects the amount of heat emitted from an object at the earth’s surface, making it effective for identifying fires and other sources of heat like cities.
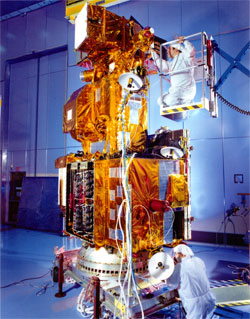 Landsat 7 satellite in the cleanroom prior to launch |
Still, Landsat offers immense utility to researchers, especially when used in concert with other sensors like the National Oceanic and Atmospheric Administration (NOAA)’s Advanced Very High Resolution Radiometer (AVHRR) and NASA’s Moderate Resolution Imaging Spectroradiometer (MODIS) as well as technologies developed by private companies and national and transnational space programs. Landsat and AVHRR have the advantage of 20-30 years of data, making them ideal for comparisons over time. This is especially important for monitoring changes in forest cover, sea ice, desertification, and urbanization.
But remote sensing isn’t limited to passive sensing. Active sensing—which sends out pulses of energy and reads the radiation that bounces back to the sensor—can provide detailed information about Earth’s surface, including the structure of a forest or the distinction between secondary and primary forest.
These technical advances, which make remote sensing data more relevant and timely, have been accompanied by favorable political and economic trends. Landsat data is now freely available to the public. At the same time a proliferation of commercial satellites offers a range of remote sensing products. Remote sensing data is no longer limited to the military, specialized institutions, or the academic world.
Applications
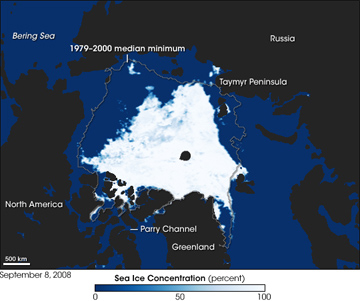 This image shows Arctic sea ice concentration on September 8, 2008, as observed by the Advanced Microwave Scanning Radiometer–Earth Observing System (AMSR-E) sensor on NASA’s Aqua satellite. The observations are collected on a pixel by pixel basis over the Arctic. The percentage of a 12.5-square-kilometer pixel covered by ice is shown in shades of dark blue (no ice) to white (100 percent ice). The gray line around the Arctic basin shows the median minimum extent of sea ice from 1979-2000. NASA image created by Jesse Allen, using data obtained courtesy of the National Snow and Ice Data Center (NSIDC). Caption by Rebecca Lindsey. |
One of the most prominent uses for earth observation satellites is monitoring sea ice. With records dating back to the 1970s, remote sensing observations have established a baseline for tracking the rapid loss of sea ice in the Arctic. Due to persistent cloud cover, which obscures optical sensors, scientists from the National Snow and Ice Data Center (NSIDC) at the University of Colorado, Boulder, use infrared (IR) sensors to infer the amount of heat emitted from the surface. Because sea ice is much colder than surrounding water, the contrast between the two is stark—at least during the winter. In the summer, melting sea ice approaches the temperature of the surrounding ocean, making it difficult to distinguish between the two. NSIDC says the new generation of multispectral sensors has helped fine-tune monitoring. What researchers have found hasn’t been encouraging, at least for polar bears: summertime sea ice extent in 2007 fell half below average for the past three decades.
Unlike sea ice, fires are relatively easy to detect using thermal infrared bands provided by MODIS sensors. Fire data is acquired at least daily, enabling researchers to monitor, in near real-time, fires burning anywhere in the world. The Fire Alert System—developed by Madagascar’s ministry of Environment, the International Resources Group, and Conservation International using data from the University of Maryland and NASA—has put this information to practical use. The system alerts subscribers via e-mail whenever burning is detected, potentially enabling them to take action on the ground when fires threaten protected areas or human settlements. MODIS data is also regularly used to monitor burning in the world’s tropical forests. In 2007 when commodity prices were peaking, MODIS revealed a surge in the number of hotspots burning across the Brazilian Amazon.
|
Accurate and timely monitoring of deforestation and forest degradation may present the next great frontier for remote sensing due to the potential emergence of REDD (Reducing Emissions from Deforestation and Degradation), a mechanism for compensating tropical countries for conserving their forests. To date, one of the biggest hurdles for the concept has been establishing credible national baselines for deforestation rates—in order to compensate countries for “avoided deforestation,” it must first be known how much forest the country had been clearing on a historical basis. For the remote sensing community, REDD presents an opportunity to showcase the power of remote sensing and generate a source of funding for improved sensing capabilities.
Presently optical sensing can do a reasonably good job distinguishing between cleared forest and natural forest—assuming cloud cover is minimal, a big assumption in the tropics. It does less well identifying and distinguishing between recovering forests, selectively logged forest, tree plantations, and degraded forests. New active sensing technologies, like cloud-penetrating radar and LIDAR, may change this. Some of these technologies may allow scientists to directly measure biomass in dense forests—currently many sensing technologies are limited by their tendency to “saturate” at a threshold well below the actual biomass in such forests.
Josef Kellndorfer, an associate scientist at the Woods Hole Research Center in Massachusetts, says that a new JAXA (Japan Aerospace Exploration Agency) satellite—known as ALOS for the Advanced Land Observation Satellite—offers great promise for monitoring deforestation and degradation.
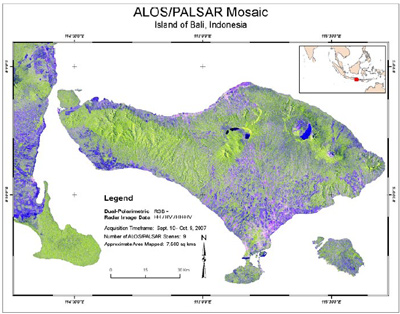 Radar image mosaic is a composite of nine individual scenes (45,000 km2) of Bali, Indonesia acquired by the PALSAR sensor carried on board ALOS. The image acquisitions were made between September 9 and October 10, 2007. From New Eyes in the Sky |
“ALOS features three sensors: an optical sensor, a typical multi-spectral sensor with visible and infrared bands; a precise stereo mapper for generation of very high resolution elevation models and topographic information, which is also optical-based; and a radar sensor named PALSAR,” he told mongabay.com.
PALSAR will allow scientists to get an annual snapshot at 20-meter resolution of all the world’s biomes, allowing the scientists to establish a baseline for forest cover every year. The sensor also has a 100-meter resolution mode that provides near-global coverage every six weeks and can be used to detect illegal logging activities even under cloud cover.
“These capabilities are exciting because we have the complete pan-tropical forest cover for 2007. We’ll get the same on an annual basis for the life of the ALOS mission. This will enable us to build a data record of forest cover on an annual basis no matter what the cloud conditions are,“ Kellndorfer said.
“Every year, within three months, we will have a full resolution pan-tropical assessment of forest cover,” he continued. “ALOS and future missions with dedicated observation strategies can thus be used as a tool to complement the overall remote sensing and monitoring effort of forests.”
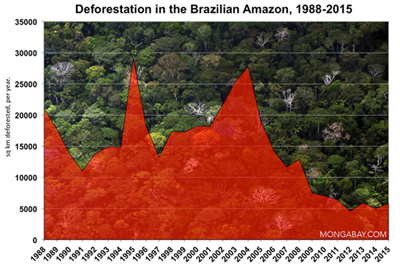 Deforestation data from INPE |
The sensing exercise will be particularly important in the Amazon—the world’s largest tropical forest. Brazil’s use of satellite data for environmental monitoring is among the most sophisticated on the planet. The country has two systems for tracking deforestation: PRODES (Program to Calculate Deforestation in the Amazon) and DETER (Real-time Detection of Deforestation). Both presently rely on optical sensing—sometimes thwarted by cloud cover—but where it has a clear view, the country can rapidly identify where deforestation is occurring. PRODES, which has a sensitivity of 6.5 ha, provides Brazil’s annual deforestation estimates (measured each August) while DETER, which has a coarser resolution of 25 ha, is a year-round alert system that updates IBAMA, Brazil’s environmental protection agency, every two weeks. This gives authorities the technical capacity—although not necessarily the political will—to combat deforestation as it occurs. The system will be enhanced when Brazil launches the Amazon-1, its own earth observation satellite with cloud-penetrating LIDAR.
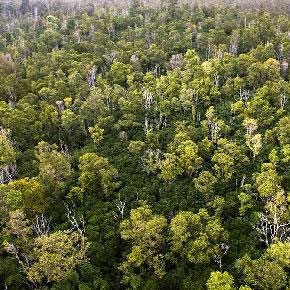 Dark green trees are the highly invasive strawberry guava tree from Brazil. This invasion is occurring in a remote rainforest reserve in Hawaii. 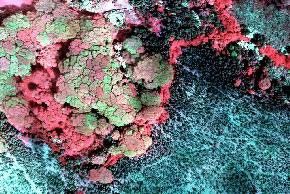 This CAO image shows the march of invasive albizia trees (pale reds and pinks) and highly invasive strawberry guava trees (intense red) in Hawaii. 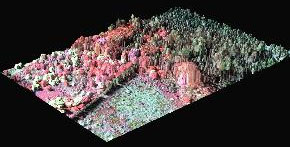 – This 3-D image shows an invasion (red-pink trees) into a protected forest reserve (blue-green trees) in lowland rainforest. Images and captions courtesy of the Carnegie Airborne Observatory |
But researchers are using remote sensing of forests for more than monitoring forest loss. Greg Asner of the Carnegie Institution’s Department of Global Ecology at Stanford University, has developed advanced applications for processing data generated by a wide range of sensors, including Carnegie’s state-of-the-art Airborne Observatory (CAO), which uses a combination of technologies aboard high-altitude aircraft to create high-resolution, three-dimensional maps of vegetation structure. These maps can be used to detect small changes in forest canopy structure from selective logging, measure biomass in dense tropical rainforests (presently limited due to “saturation” in carbon-dense ecosystems), and even distinguish between individual plant species, including invasive species. Asner’s group recently won grants from the Gordon and Betty Moore to expand upon CLASlite—a desktop monitoring application that enables conservationists anywhere to measure forest biomass and deforestation—and to develop its spectranomics project. This project has the potential to inventory biodiversity across 40,000 acres of rainforest per day by detecting the chemical and spectral (light-reflecting) properties of individual plant species across a diverse landscape.
“Infrared reflectances of tropical forest canopies are often unique signatures for species,” Asner said. “This new technology will help us to capture previously hidden ‘chemical fingerprints’ of rainforest species … It will be a new era in rainforest research.”
Satellite data is also providing insights into the drivers of deforestation. Researchers at the Woods Hole Research Center are using remote sensing to map logging roads and anticipate future forest disturbance in the Congo and the Amazon. Meanwhile, Holly Gibbs, a researcher at Stanford University, recently used remote sensing data to evaluate shifting patterns of tropical deforestation. She found that 80 percent of agricultural expansion since the 1980s came at the expense of forests
“I recently analyzed the Landsat database created by the UN FAO to estimate the probable land sources for expanding croplands,” she told mongabay.com. “I was also able to consider changing patterns of agricultural expansion during the 1980s and 1990s and demonstrate that the amount of cropland expanding into forested areas, rather than grassland or previously disturbed forests, is increasing. Documenting changing patterns in land use is becoming increasingly important as we see mounting demands for global food, feed, and fuel, highlighting the importance of continuing the longtime history of Landsat into coming decades.”
Gibbs says increased accessibility has been key to wider use of satellite data.
“Satellite data is becoming increasingly accessible to everyone from a local park ranger to scientists at major universities, opening the door to more diverse analyses,” she said. “The creation of ‘free’ global Landsat mosaics, for example, is a major push for initiatives to Reduce Emissions from Deforestation and Degradation [REDD] across the tropics that rely on what used to be very costly data.”
GOOGLE EARTH
While most remote sensing work remains the domain of specialists, the emergence of Google Earth has leveled the playing field, offering the potential that Google Earth can do for remote sensing what the iPod did for digital music—reach and engage the masses. In the process it is enhancing the ability of researchers to communicate their work to policy makers, other scientists, and most importantly the general public.
Google Earth aggregates and organizes satellite imagery, aerial photography, and GIS 3D from a range of sources and presents it in a format that is easily consumed by the general public. Indeed, its ease of use and presentation is driving public interest in geospatial technology and applications. Through KML, Google Earth’s programming language, users “interact” with the planet, attaching images and other information to geospatial data. The functionality makes Google Earth a tool for conservation. Google is playing an active role in this development through its Google Earth Outreach program, an initiative that works with nonprofits to develop tools using Google Earth.
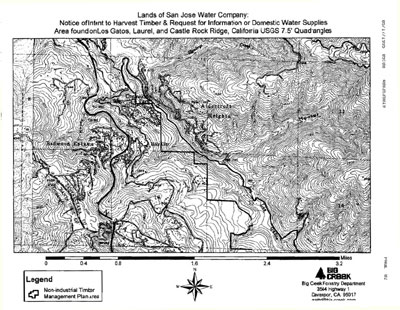 Logging plan notification and map received by local residents. 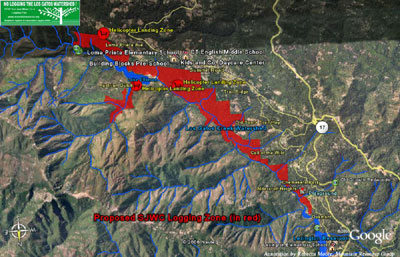 Logging proposal elements remapped in Google Earth. Image courtesy of Google Earth. See more at NAIL case study |
Part of the inspiration for Google Earth Outreach came from within. Rebecca Moore, a programmer at Google, used Google Earth to document a planned logging project near her home in Santa Cruz County, California. Working with members of her community, Moore created a virtual layer to map the area that would be affected. Her subsequent data animation, which took users on a virtual flyover of the proposed logging zone, generated an outcry, and led to cancellation of the project. Google Outreach was established shortly thereafter, in June 2007.
Moore’s experience was an early demonstration of the power of organizing data spatially as a visual tool for communication. Environmental groups around the world have now seized on the possibilities, but researchers, too, have found that Google Earth is an effective way to publish results in an accessible format: many of the remote sensing applications described above now have Google Earth components.
“Because Google Earth provides, for many areas, such a realistic model of the real Earth, you almost feel as if you are ‘on that mountaintop’ or ‘looking over that valley,’” said Moore, who is now the manager of Google Earth Outreach. “This immersive experience enables conservation organizations to convey complex environmental issues more quickly and persuasively to busy decision-makers, the media, and the general public. Many environmental groups have already achieved tangible successes as a result of these projects, and we’re honored to be a small part of that.”
Exchanging bows and arrows for GPS units
One of the early Google Earth Outreach projects involved indigenous tribes in the Amazon rainforest. Facing an onslaught of threats to their forest lands and culture, the tribes have embraced advanced technology as a means to protect and better manage their rainforest homeland. The tribes—including the Surui in western Brazil and the Wayana and Trio in Suriname, are using GPS to map their lands and plot rivers, sites of spiritual significance, and their resources, including medicinal plants and rich hunting grounds.
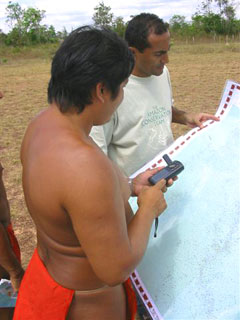 GPS mapping of Tumucumaque in Brazil. Image courtesy of ACT. |
“Google Earth is used primarily for vigilance,” said Vasco van Roosmalen, Brazil program director for the Amazon Conservation Team (ACT), an organization that has coordinated the project with the tribes. “Indians log on to Google Earth and study images, inch by inch, looking to see where new gold mines are popping up or where invasions are occurring. With the newly updated, high-resolution images of the region, they can see river discoloration which could be the product of sedimentation and pollution from a nearby mine. They are able to use these images to find the smallest gold mine.”
“The Surui know little about the Internet, but Google knows little about the forest, so working together we will be stronger,” Chief Almir Surui of the Surui tribe said through a translator. “We are mapping and monitoring our lands to protect our resources from loggers and ranchers.”
Mark Plotkin, founder of ACT, adds that the technology has brought an unexpected benefit: strengthening generational ties in communities.
“The younger generation needs the older generation to fill in the gaps on the maps,” he said. “No amount of technology is going to tell these guys the history of their land or where to find the plants needed to cure an infection. It is only the tribal elders who have this information.”
The Rainforest Foundation UK and the Global Canopy Programme are taking a similar approach in Congo and Cameroon, respectively, helping communities map their lands to protect against illegal loggers and other forms of encroachment.
“Villagers are trained how to map field data with GPS units. All data is logged and put into a database that can be displayed on Google Earth,” said Andrew Mitchell, founder and director of the London-based Global Canopy Program. “Communities swap information and can see things like when illegal loggers or miners are encroaching into their forest.”
Google Earth has expanded beyond activism to aid scientists, emerging as an ideal way to publish scientific results in an accessible and meaningful format. While Google Earth is not going to replace scientific journals any time soon, it offers a concise and visual format for presenting research that can be more compelling than data points on a chart, rows in a spreadsheet, or a four-color map.
 Costing Nature. |
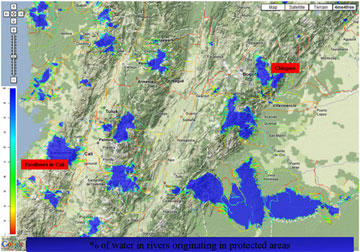
A prime example is offered by Mark Mulligan of the Environmental Monitoring and Modeling Group at King’s College, London. This group has fully capitalized on the power of Google Earth. Mulligan has developed a series of KMLs to help visualize spatial data in Google Earth, including several land-use-change monitoring applications which show historical changes in tree cover in and around protected areas throughout the world. The applications serve as the basis for HealthyPlanet.org, an initiative that allows people to sponsor specific pieces of many of the planet’s 77,000 protected areas.
“The Healthy Planet Foundation‘s Guardian project is about connecting people with conservation by using the World Database of Protected Areas in Google Earth and Google Maps as the canvas for conservation organizations to present projects in particular protected areas. Donors can support these projects by adopting 1 hectare or 1 km square slices of protected areas in order to help map and monitor land-use change in and around protected areas,” he explained. “Conservation, environment, and development organizations submit proposals which are first reviewed by our conservation advisory board before making it onto the maps. ‘Armchair’ conservationists are then directed to these projects and can choose to give their time, funding, or both to support a specific project in a particular park.”
Another visualization, Costing Nature, allows users to trace stream flow in an urban area back to the protected area where it fell as rain, providing a potent example of the value of ecosystem services. Mulligan’s group has also developed KMLs examining the impact of oil production in the Ecuadorean Amazon, sea-level rise under different climate scenarios, and the distribution of tropical cloud forests.
“The rationale for these tools is to provide an easy mechanism for visual change detection for non-remote-sensing specialists who may be interested in environmental change research, awareness raising, and conservation monitoring or prioritization uses,” Mulligan said.
“Google Earth brings remote sensing to the masses. Traditionally, remote sensing data are difficult to get hold of, difficult to process, and beyond the means of many of the smaller conservation organizations. Google Earth allows these organizations to look at their projects from space and draw upon a wealth of environmental data in addition to the imagery.”
“Clearly conservation needs good conservation professionals working with communities on the ground, but it also needs to harness the significant body of interested citizens who can do their bit, now that Google and partners have supplied some of the tools, and conservation organizations have supplied the data and information to enable this.”
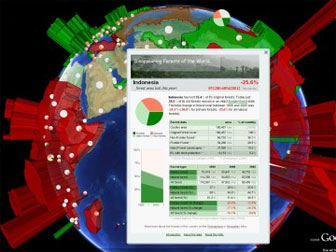 Disappearing Forests of the World. This KML shows deforestation data from a number of sources for different countries, including a live ticker for each country. The world has lost close to half of its forests already today, and the continued high pace of deforestation contributes greatly to climate change and the loss of biodiversity. Google Earth file. |
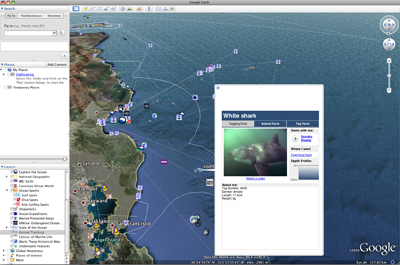
David Tryse is one of these citizens. Neither a scientist nor a formal conservationist, Tryse has a concern for the welfare of the planet that led him to develop a KML for the Zoological Society of London’s EDGE of Existence program, an initiative to promote awareness of and generate conservation funding for 100 of the world’s rarest species. The KML allows people to surf the planet to see photos of endangered species, information about their habitat, and the threats they face. Tryse has since developed a deforestation tracking application, a KML that highlights hydroelectric threats to Borneo’s rivers as well as oil spills. He is working on a new tool that will make it even easier for people to create visualizations on Google Earth.
“A decade or more back something like high-resolution satellite imagery for the whole planet would have been accessible only to a handful of people working in government agencies, in resource extraction, or as scientists,” Tryse said. “Today it is in the hands of hundreds of millions of people. It’s impossible to care about something if you don’t know it exists, but now people can fly across the planet and zoom in to ‘see for themselves’ in a whole different way many of the issues of today, whether it’s a humanitarian crisis like burned-down villages in Darfur or an environmental issue like how very little forest is left for some of the world’s most endangered animals on the EDGE list.”
Tryse added: “In seconds anyone can zoom in to see, for example, the huge fires from Shell’s gas-flaring operations in the Nigerian delta or follow the discolored toxic runoff along a hundred kilometers of (recently pristine) rainforest river downstream of a goldmine in Peru or Indonesian Papua.”
|
Google Earth is also helping facilitate communication within communities, according to the Jane Goodall Institute, another Google Earth Outreach partner. This group, which works to protect African great apes and their habitats, found that Google Earth served “as a tool to discuss landscapes and land uses with local communities that have limited education or understanding of maps. Villagers were able to recognize land features, even on 15-m Landsat image because of the hills and valleys that are easily recognizable in 3D.”
Even though Google Earth is primarily limited to optical sensing, even veteran GIS experts find themselves using it beyond presentations and outreach, particularly for getting an overview of a landscape for further investigation.
“We use Google Earth a lot to get a sense of what’s there,” said Columbia’s DeFries. “We use it to decide where to take a look at great detail and whether to order a time series. “
A case in point occurred in 2005 when Tanzanian ecologist Julian Bayliss spotted a 7,000-hectare tract of forest on Mount Mabu in Mozambique which, to his knowledge, had never been biologically assessed. Three years later expeditions to Mount Mabu turned up hundreds of species of plants and animals, including some that are new to science.
Google Earth is also being used for original research. A highly publicized example was the finding last year that cattle, along with grazing deer, tend to align themselves with the Earth’s magnetic field lines, in a north-south direction. The work, published in “Proceedings of the National Academy of Sciences (PNAS),” was based on analysis of 8,510 cattle spotted in Google Earth images of 308 pastures and plains around the world. Overall, 60-70 percent of cattle were oriented north-south.
As Google Earth continues to use cutting-edge remote sensing technologies it seems likely that it will become an increasingly important tool for research, adding to its value for organization and outreach.
“Many scientists are publishing the results of their studies (maps and imagery) in Google Earth as a means of enabling policy makers to engage better with the policy outcomes of scientific research,” Mulligan said.
David Tryse hopes Google Earth will go beyond that.
“I am convinced that transparency and ease of access to information provided by Google Earth is a great example of how citizens of the future will use technology to choose their governments and products they buy.”