Carbon trading could protect forests, reduce rural poverty
Carbon trading could protect forests, reduce rural poverty
mongabay.com
February 26, 2008 [corrected March 3]
|
|
Carbon trading from avoided deforestation (REDD) credits could yield billions of dollars for tropical countries, according to analysis by mongabay.com, a leading tropical forest web site.
Using conservative estimates for carbon storage in tropical forests for 63 countries, mongabay.com estimates that reducing deforestation by 10 percent would generate $767 million to $4.6 billion per year at carbon prices ranging from $5-30 per ton of CO2 [tCO2e]. For comparison, the EU’s ETS market for carbon credits is presently around $32/tCO2e. A 20 percent reduction would generate $1.5 to 9.2 billion, while a 50 percent reduction would yield $3.8 to 23 billion annually. The figures show the proceeds from REDD carbon credits would dwarf the $1.1 billion in international funding for forestry spent annually over the past decade and could offer developing countries a way to diversify earnings in their forestry sector while at the same time safeguarding important ecosystem services — like watershed protection and biodiversity conservation — and forest option values.
“Conservationists have long struggled to find a way to finance forest protection. Now REDD offers the potential to make forest conservation profitable,” said Rhett A. Butler, founder and editor of mongabay.com. “The key going forward will be ensuring that forest communities and rural populations see benefits from REDD. Without addressing the underlying drivers of deforestation — rural poverty and, increasingly, industrial actors — REDD will be dead in the forest.”
Still Butler says the potential financial gains from REDD are immense — likely well above the projections.
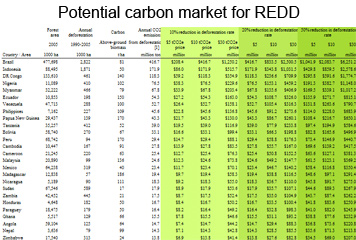 Chart for 63 tropical countries |
“The figures used in these calculations are quite conservative, especially in terms of carbon stored in forest biomass. For example, the U.N. figures for Indonesia — 50 tons of carbon per hectare — are only a fraction of what is seen in peatlands and rainforests — upwards of 300 t/ha. Indonesia could potentially see several billion dollars per year from REDD.”
The calculations use average annual deforestation rates from 1990-2005 as a baseline and assume 50 percent of above-ground biomass is lost through deforestation. Forest carbon data comes from the U.N. Food and Agriculture Organization. Actual carbon savings from reducing deforestation are likely to be considerably higher, translating to increased carbon credit potential. The calculations exclude forest-rich countries for which FAO data is missing or incomplete, including Guyana, Suriname, and Belize. Adding these countries would further boost REDD earnings forecasts.
The updated projections come less month after the first REDD deal was signed in the Indonesian province of Aceh. The project — backed by the Government of Aceh, Fauna & Flora International (FFI) and Carbon Conservation — will protect the 1.9 million-acre Ulu Masen forest, a tract of rainforest home to the Sumatran elephant, the Clouded leopard , the Sumatran tiger, and the Sumatran orangutan. By preventing logging and conversion of Ulu Masen forest for oil palm plantations, planners expect to reduce carbon dioxide emissions by 100 million tons over 30 years. The proceeds — in the form of carbon credits — will help fund health and education projects in the local community.
Butler says that REDD may offer attractive economic returns relative to conventional logging and agricultural use of forest land, especially for rural communities which too often miss out on the benefits from industrial development of rainforests.
“Based on work by Dan Nepstad at the Woods Hole Research Institute, we’re talking break-even points of around $3 per ton of carbon for forgoing development of most of the Amazon. Cattle ranching — by far the leading driver of deforestation in the Brazilian Amazon — has offered far less than that on a historical basis,” said Butler. “In Indonesia, a study by the World Agroforestry Centre (ICRAF) and the Center for International Forestry Research (CIFOR) showed that Indonesia currently is seeing benefits of $0.34 per ton of CO2 — mostly from agriculture. For comparison EU carbon prices are presently over $32 per ton.”
“These studies show that in addition to making sense from a conservation standpoint, REDD could be an economically viable form of land use for some of the world’s most disadvantaged populations.”
Potential market value of REDD in 63 tropical countries [expanded chart]
| Forest area | Annual forest loss | Carbon | Annual CO2 | Proceeds from a 10% reduction in deforestation rate | Proceeds from a 20% reduction in deforestation rate | Proceeds from a 50% reduction in deforestation rate | |||||||
| 2005 | 1990-2005 | Above ground biomass | from forest loss | $5 | $10 | $30 | $5 | $10 | $30 | $5 | $10 | $30 | |
| Country / Area | 1000 ha | 1000 ha | t/ha | M tons | $US million | $US million | $US million | ||||||
| Brazil | 477,698 | 2,822 | 81 | 417 | 208 | 417 | 1,250 | 417 | 833 | 2,500 | 1,042 | 2,084 | 6,251 |
| Indonesia | 88,495 | 1,871 | 50 | 172 | 86 | 172 | 516 | 172 | 344 | 1,031 | 430 | 860 | 2,579 |
| DR Congo | 133,610 | 461 | 140 | 118 | 59 | 118 | 355 | 118 | 237 | 710 | 296 | 592 | 1,775 |
| Nigeria | 11,089 | 410 | 102 | 77 | 38 | 77 | 230 | 77 | 153 | 459 | 191 | 383 | 1,148 |
| Myanmar | 32,222 | 466 | 79 | 68 | 34 | 68 | 203 | 68 | 136 | 407 | 170 | 339 | 1,017 |
| Ecuador | 10,853 | 198 | 150 | 54 | 27 | 54 | 163 | 54 | 109 | 326 | 136 | 272 | 815 |
| Venezuela | 47,713 | 288 | 100 | 53 | 26 | 53 | 158 | 53 | 105 | 316 | 132 | 264 | 791 |
| Philippines | 7,162 | 227 | 109 | 46 | 23 | 46 | 137 | 46 | 91 | 274 | 114 | 228 | 684 |
| Papua New Guinea | 29,437 | 139 | 170 | 43 | 22 | 43 | 130 | 43 | 87 | 260 | 108 | 217 | 650 |
| Tanzania | 35,257 | 412 | 52 | 39 | 19 | 39 | 117 | 39 | 78 | 234 | 97 | 195 | 585 |
| Bolivia | 58,740 | 270 | 67 | 33 | 17 | 33 | 99 | 33 | 66 | 199 | 83 | 166 | 497 |
| Peru | 68,742 | 94 | 170 | 29 | 15 | 29 | 88 | 29 | 59 | 176 | 73 | 147 | 441 |
| Cambodia | 10,447 | 167 | 91 | 28 | 14 | 28 | 83 | 28 | 56 | 167 | 70 | 139 | 417 |
| Cameroon | 21,245 | 220 | 63 | 25 | 13 | 25 | 76 | 25 | 51 | 153 | 64 | 127 | 381 |
| Malaysia | 20,890 | 99 | 136 | 25 | 12 | 25 | 74 | 25 | 49 | 148 | 62 | 123 | 369 |
| Mexico | 64,238 | 319 | 40 | 23 | 12 | 23 | 70 | 23 | 47 | 140 | 58 | 117 | 350 |
| Madagascar | 12,838 | 57 | 186 | 19 | 10 | 19 | 58 | 19 | 39 | 117 | 49 | 97 | 291 |
| Nicaragua | 5,189 | 90 | 111 | 18 | 9 | 18 | 55 | 18 | 37 | 110 | 46 | 92 | 275 |
| Sudan | 67,546 | 589 | 17 | 18 | 9 | 18 | 54 | 18 | 36 | 107 | 45 | 89 | 268 |
| Zambia | 42,452 | 445 | 21 | 17 | 9 | 17 | 52 | 17 | 35 | 105 | 44 | 87 | 262 |
| Honduras | 4,648 | 182 | 50 | 17 | 8 | 17 | 50 | 17 | 33 | 100 | 42 | 84 | 251 |
| Paraguay | 18,475 | 179 | 50 | 16 | 8 | 16 | 49 | 16 | 33 | 98 | 41 | 82 | 246 |
| Ghana | 5,517 | 129 | 66 | 16 | 8 | 16 | 47 | 16 | 31 | 93 | 39 | 78 | 233 |
| Angola | 59,104 | 125 | 64 | 15 | 7 | 15 | 44 | 15 | 29 | 88 | 37 | 74 | 221 |
| Nepal | 3,636 | 79 | 99 | 14 | 7 | 14 | 43 | 14 | 29 | 86 | 36 | 71 | 214 |
| Zimbabwe | 17,540 | 313 | 24 | 14 | 7 | 14 | 41 | 14 | 28 | 83 | 35 | 69 | 207 |
| Liberia | 3,154 | 60 | 116 | 13 | 6 | 13 | 38 | 13 | 26 | 77 | 32 | 64 | 192 |
| Laos | 16,142 | 78 | 73 | 10 | 5 | 10 | 31 | 10 | 21 | 62 | 26 | 52 | 156 |
| Guatemala | 3,938 | 54 | 96 | 9 | 5 | 9 | 28 | 9 | 19 | 57 | 24 | 47 | 142 |
| Colombia | 60,728 | 47 | 98 | 9 | 4 | 9 | 26 | 9 | 17 | 51 | 21 | 43 | 128 |
| Solomon Islands | 2,172 | 40 | 100 | 7 | 4 | 7 | 22 | 7 | 15 | 44 | 18 | 36 | 109 |
| Benin | 2,351 | 65 | 60 | 7 | 4 | 7 | 21 | 7 | 14 | 43 | 18 | 36 | 107 |
| Thailand | 14,520 | 96 | 39 | 7 | 3 | 7 | 21 | 7 | 14 | 41 | 17 | 34 | 103 |
| Guinea | 6,724 | 46 | 76 | 6 | 3 | 6 | 19 | 6 | 13 | 38 | 16 | 32 | 96 |
| Somalia | 7,131 | 77 | 44 | 6 | 3 | 6 | 18 | 6 | 12 | 37 | 15 | 31 | 92 |
| Congo | 22,471 | 17 | 186 | 6 | 3 | 6 | 17 | 6 | 12 | 35 | 14 | 29 | 87 |
| Central African Republic | 22,755 | 30 | 99 | 5 | 3 | 5 | 16 | 5 | 11 | 33 | 14 | 27 | 82 |
| Uganda | 3,627 | 86 | 30 | 5 | 2 | 5 | 14 | 5 | 10 | 29 | 12 | 24 | 71 |
| Senegal | 8,673 | 45 | 33 | 3 | 1 | 3 | 8 | 3 | 5 | 16 | 7 | 13 | 40 |
| Gabon | 21,775 | 10 | 137 | 3 | 1 | 3 | 8 | 3 | 5 | 15 | 6 | 13 | 38 |
| Mozambique | 19,262 | 50 | 25 | 2 | 1 | 2 | 7 | 2 | 5 | 14 | 6 | 12 | 35 |
| Malawi | 3,402 | 33 | 38 | 2 | 1 | 2 | 7 | 2 | 5 | 14 | 6 | 12 | 35 |
| Chad | 11,921 | 79 | 16 | 2 | 1 | 2 | 7 | 2 | 5 | 14 | 6 | 11 | 34 |
| Togo | 386 | 20 | 50 | 2 | 1 | 2 | 5 | 2 | 4 | 11 | 5 | 9 | 27 |
| Kenya | 3,522 | 12 | 76 | 2 | 1 | 2 | 5 | 2 | 3 | 10 | 4 | 9 | 26 |
| Equatorial Guinea | 1,632 | 15 | 57 | 2 | 1 | 2 | 5 | 2 | 3 | 10 | 4 | 8 | 24 |
| Burkina Faso | 6,794 | 24 | 35 | 2 | 1 | 2 | 5 | 2 | 3 | 9 | 4 | 8 | 23 |
| Sierra Leone | 2,754 | 19 | 40 | 1 | 1 | 1 | 4 | 1 | 3 | 9 | 4 | 7 | 21 |
| Panama | 4,294 | 5 | 114 | 1 | 1 | 1 | 3 | 1 | 2 | 7 | 3 | 6 | 17 |
| Timor-Leste | 798 | 11 | 50 | 1 | 1 | 1 | 3 | 1 | 2 | 6 | 3 | 5 | 15 |
| Burundi | 152 | 9 | 60 | 1 | 1 | 1 | 3 | 1 | 2 | 6 | 3 | 5 | 15 |
| Costa Rica | 2,391 | 12 | 47 | 1 | 0 | 1 | 3 | 1 | 2 | 6 | 2 | 5 | 15 |
| French Guiana | 8,063 | 2 | 250 | 1 | 0 | 1 | 3 | 1 | 2 | 5 | 2 | 4 | 13 |
| Sri Lanka | 1,933 | 28 | 17 | 1 | 0 | 1 | 3 | 1 | 2 | 5 | 2 | 4 | 13 |
| Brunei Darussalam | 278 | 2 | 115 | 0 | 0 | 0 | 1 | 0 | 1 | 3 | 1 | 2 | 7 |
| El Salvador | 298 | 5 | 50 | 0 | 0 | 0 | 1 | 0 | 1 | 3 | 1 | 2 | 7 |
| Guinea-Bissau | 2,072 | 10 | 24 | 0 | 0 | 0 | 1 | 0 | 1 | 2 | 1 | 2 | 6 |
| Trinidad and Tobago | 226 | 1 | 84 | 0 | 0 | 0 | 0 | 0 | 0 | 1 | 0 | 0 | 1 |
| Haiti | 105 | 1 | 57 | 0 | 0 | 0 | 0 | 0 | 0 | 0 | 0 | 0 | 1 |
| Jamaica | 339 | 0 | 80 | 0 | 0 | 0 | 0 | 0 | 0 | 0 | 0 | 0 | 1 |
| Bangladesh | 871 | 1 | 29 | 0 | 0 | 0 | 0 | 0 | 0 | 0 | 0 | 0 | 1 |
| Guadeloupe | 80 | 0 | 50 | 0 | 0 | 0 | 0 | 0 | 0 | 0 | 0 | 0 | 0 |
| Dominica | 46 | 0 | 50 | 0 | 0 | 0 | 0 | 0 | 0 | 0 | 0 | 0 | 0 |
| TOTAL | 767 | 1,533 | 4,600 | 1,533 | 3,067 | 9,200 | 3,833 | 7,667 | 23,000 | ||||
NOTES
- “Above-ground biomass” is derived from FAO figures
- “Annual CO2 emissions from forest loss M tons” assumes that 50 percent of above-ground biomass carbon is lost during deforestation
- Numbers in final 9 columns represent CO2 offset prices per tCO2e