Change in Atlantic circulation could plunge Europe into cold winters
Rhett A. Butler, mongabay.com
December 1, 2005
The Atlantic Ocean circulation that carries warm waters north and returns cold waters south is slowing, putting Europe at risk of colder temperatures, according to research published in Nature.
The Atlantic Heat Conveyor, the system of currents in the Atlantic Ocean that result in a net transport of warm water into the northern hemisphere, keeps western Europe warmer than regions at similar latitudes in other parts of the world. A weakening of the system, which includes the Gulf Stream, could cause a cooling in northwest Europe.
Below are two news releases, one from the University of Southampton detailing the current study, and an earlier one from NASA looking at the slowing of currents in the Atlantic.
Could the Atlantic Current switch off?
University of Southampton
01 December 2005
The Atlantic Ocean overturning that maintains Europe’s moderate climate has slowed by 30 per cent according to scientists from the National Oceanography Centre at the University of Southampton in research published today in Nature (Thursday, 1 December 2005).
Professor Harry Bryden, Dr Stuart Cunningham and University of Southampton research student Hannah Longworth have been researching the flow of the Atlantic Ocean across latitude 25 degrees north – comparing measurements across the Atlantic taken in 2004 with records from 1957, 1981, 1992 and 1998. Ocean flow is measured in Sverdrups, equivalent to one million tonnes of water a second. The team estimate a decrease in the overturning from 20 Sv in earlier surveys to 14 Sv in 2004.
Professor Bryden, who is Professor of Physical Oceanography at the University’s School of Ocean and Earth Science, said, ‘The Atlantic meridional overturning circulation, sometimes called the Conveyor Belt, carries warm upper waters into northern latitudes and returns cold deep waters southward across the equator. It is a massive system that includes the Gulf Stream and it carries heat northward out of the tropics into the northern Atlantic warming the atmosphere and helping to provide northern Europe with a moderate climate.
‘In previous studies over the last 50 years the overturning circulation and heat transport across 25°N were reasonably constant. We were surprised that the circulation in 2004 was so different from previous estimates.
 The North Atlantic Current Pathways associated with the transformation of warm subtropical waters into colder subpolar and polar waters in the northern North Atlantic. Along the subpolar gyre pathway the red to yellow transition indicates the cooling to Labrador Sea Water, which flows back to the subtropical gyre in the west as an intermediate depth current (yellow). More information Credit: ©Jack Cook, Woods Hole Oceanographic Institution |
‘Estimates of the size of the overturning circulation have been based primarily on hydrographic sections – where a ship takes measurements at regular intervals across the Atlantic. Because of the importance of the overturning circulation for European climate, we have set up a continuous observing system to monitor the overturning using moored instruments. Last year’s expedition was meant to provide a traditional observation of the overturning to initialise the new observing system.’
Climate models suggest that increased levels of carbon dioxide in the atmosphere will result in a slowdown of the Atlantic overturning circulation. Scientists fear that disruption to this circulation could result in a several degree drop in temperatures in as little as 20 years. The Natural Environment Research Council, NERC, has funded a £20 million climate change research programme called RAPID, which is co-ordinated by scientists at the National Oceanography Centre, Southampton. A primary goal of RAPID is to continuously monitor the Atlantic meridional overturning circulation.
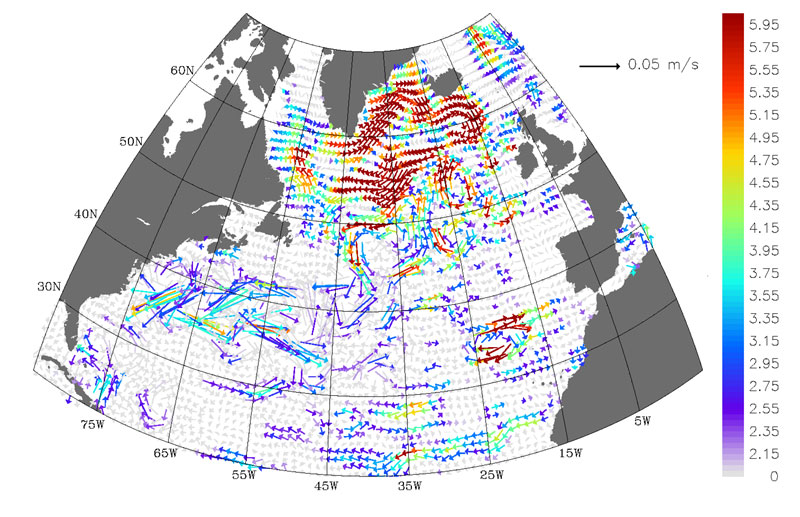 Trend Velocities in North Atlantic The trend of the velocities (meters per second per decade) derived from NASA Pathfinder altimeter data for the period May 1992 to June 2002. The colored vectors are statistically significant. Note how the vectors trace the following graphic of the subpolar circulation in reverse direction, which denotes a slowing gyre. Credit: Sirpa Hakkinen, NASA GSFC. 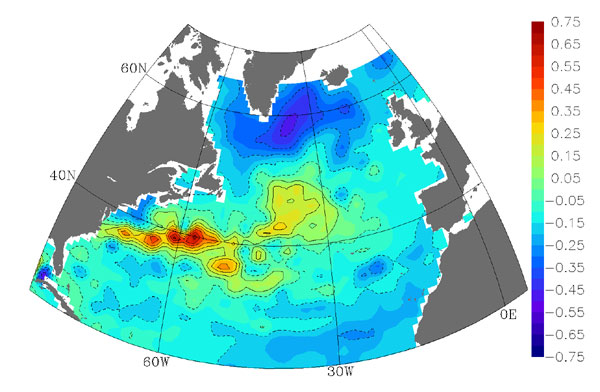 Dominant Pattern of Variability of the Sea-surface Height in the 1990s This image shows the dominant pattern of variability of the sea-surface height in the 1990s. The slope of the sea-surface height is in balance with ocean currents, much in the way weather maps of pressure relate to winds. The large blue region in the northern Atlantic represents a slowing of the counter-clockwise, cyclonically circulating subpolar gyre. Credit: Sirpa Hakkinen, NASA GSFC. |
Since 2004 scientists at the National Oceanography Centre, Southampton, led by Dr Stuart Cunningham, have deployed an instrument array across the Atlantic at 25°N – running just south of the Canaries, from the Saharan coast of Africa to Florida. The monitoring array involves close collaboration with American scientists at University of Miami and NOAA’s Atlantic Oceanographic and Meteorological Laboratory. To work out the circulation and heat transport, it is essential to measure the temperature and salinity of the water and the speed it is moving.
An array of 22 moorings continuously monitors the Atlantic’s circulation, nine across the Deep Western Boundary Current east of the Bahama Islands, four across the Mid-Atlantic Ridge and nine across the continental slope off the coast of Africa. The moorings are anchored to the seabed on wires up to 5000 metres long. Instruments that measure salinity, temperature, pressure and currents take continuous readings that are collected on annual visits by ship. The project is due to end in 2008 giving four years of continuous observation.
Dr Stuart Cunningham, who has just returned from an expedition to retrieve data from the moored instruments near the Canaries, said, ‘Continuous monitoring could alert us to potential rapid climate change. This is an early warning system in operation for the Atlantic overturning. Before this array was set up, the only means of gathering data was to make transatlantic research cruises taking measurements that took a snapshot of ocean conditions at a specific time giving little information on seasonal variability.’
This story is derived from a University of Southampton news release. This original version appears at Could the Atlantic Current switch off?.
April 15, 2004 – (date of web publication)
SATELLITES RECORD WEAKENING NORTH ATLANTIC CURRENT
NASA release
A North Atlantic Ocean circulation system weakened considerably in the late 1990s, compared to the 1970s and 1980s, according to a NASA study.
Sirpa Hakkinen, lead author and researcher at NASA’s Goddard Space Flight Center, Greenbelt, Md. and co-author Peter Rhines, an oceanographer at the University of Washington, Seattle, believe slowing of this ocean current is an indication of dramatic changes in the North Atlantic Ocean climate. The study’s results about the system that moves water in a counterclockwise pattern from Ireland to Labrador were published on the Internet by the journal Science on the Science Express Web site at: http://www.sciencexpress.org.
The current, known as the sub polar gyre, has weakened in the past in connection with certain phases of a large-scale atmospheric pressure system known as the North Atlantic Oscillation (NAO). But the NAO has switched phases twice in the 1990s, while the subpolar gyre current has continued to weaken. Whether the trend is part of a natural cycle or the result of other factors related to global warming is unknown.
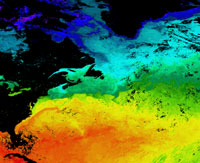 Terra MODIS Sea Surface Temperatures for North Atlantic Ocean This image of North Atlantic Ocean sea surface temperatures represents an eight-day composite from Sept 6 – Sept 13, 2001 from the Moderate Resolution Imaging Spectroradiometer (MODIS) instrument on Terra. The red and orange colors represent warmer water, while the blue shades represent cold water in the higher latitudes. The Gulf Stream is evident along the U.S. eastern seaboard. The color bar is in units of degrees Celsius. Credit: Ronald Vogel, SAIC for NASA GSFC. |
“It is a signal of large climate variability in the high latitudes,” Hakkinen said. “If this trend continues, it could indicate reorganization of the ocean climate system, perhaps with changes in the whole climate system, but we need another good five to 10 years to say something like that is happening.” Rhines said, “The subpolar zone of the Earth is a key site for studying the climate. It’s like Grand Central Station there, as many of the major ocean water masses pass through from the Arctic and from warmer latitudes. They are modified in this basin. Computer models have shown the slowing and speeding up of the subpolar gyre can influence the entire ocean circulation system.”
Satellite data makes it possible to view the gyre over the entire North Atlantic basin. Measurements from deep in the ocean, using buoys, ships and new autonomous “robot” Seagliders, are important for validating and extending the satellite data. Sea-surface height satellite data came from NASA’s Seasat (July, August 1978), U.S. Navy’s Geosat (1985 to 1988), and the European Space Agency’s European Remote Sensing Satellite1/2 and NASA’s TOPEX/Poseidon (1992 to present).
Hakkinen and Rhines were able to reference earlier data to TOPEX/Poseidon data, and translate the satellite sea-surface height data to velocities of the subpolar gyre. The subpolar gyre can take 20 years to complete its route. Warm water runs northward through the Gulf Stream, past Ireland, before it turns westward near Iceland and the tip of Greenland.
The current loses heat to the atmosphere as it moves north. Westerly winds pick up that lost heat, creating warmer, milder European winters. After frigid Labrador Sea winters, the water in the current becomes cold, salty and dense, plunges beneath the surface, and heads slowly southward back to the equator. The cycle is sensitive to the paths of winter storms and to the buoyant fresh water from glacial melting and precipitation, all of which are experiencing great change.
While previous studies have proposed winds resulting from the NAO have influenced the subpolar gyre’s currents, this study found heat exchanges from the ocean to the atmosphere may be playing a bigger role in the weakening current. Using Topex/Poseidon sea-surface height data, the researchers inferred Labrador Sea water in the core of the gyre warmed during the 1990s. This warming reduces the contrast with water from warmer southern latitudes, which is part of the driving force for ocean circulation.
The joint NASA-CNES (French Space Agency) Topex/Poseidon oceanography satellite provides high-precision data on the height of the world’s ocean surfaces, a key measure of ocean circulation and heat storage in the ocean.
NASA’s Earth Science Enterprise is dedicated to understanding the Earth as an integrated system and applying Earth System Science to improve prediction of climate, weather and natural hazards using the unique vantage point of space. NASA, the National Oceanic and Atmospheric Administration, and the National Science Foundation funded the study.