2005 is second warmest year on record
Rhett A. Butler, mongabay.com
December 16, 2005
SUMMARY: Two new reports from government agencies say that 2005 is second warmest year on record. The first from NOAA focuses primarily on weather in the United States, while the second, from the World Meteorological Organization (WMO) looks at global temperatures and weather events.
The WMO says that 2005 is currently the second warmest year on record, after 1998. Averaged separately for both hemispheres, 2005 surface temperatures for the northern hemisphere (0.65° C above 30-year mean) are likely to be the warmest and for the southern hemisphere (0.32° C above 30-year mean), the fourth warmest in the instrumental record from 1861 to the present.
The WMO notes that 2005 brought unusual weather to parts of the world, including prolonged droughts in Africa, Europe, Australia, the United States, and the Amazon Basin; heavy precipitation and flooding in parts of Asia, Europe, and North and South America; a record Atlantic hurricane season; declines in Arctic sea ice; and greater ozone depletion in the Antarctic and Arctic.
Noaa reports warmer 2005 for the united states, near-record warmth globally hurricanes, floods, snow and wildfires all notable
NOAA release
After a record-breaking hurricane season, blistering heat waves, lingering drought and a crippling Northeast blizzard, 2005 is ending as a warm year in the United States. It will come close to the all-time high global annual average temperature, based on preliminary data gathered by scientists at the NOAA National Climatic Data Center in Asheville, N.C.
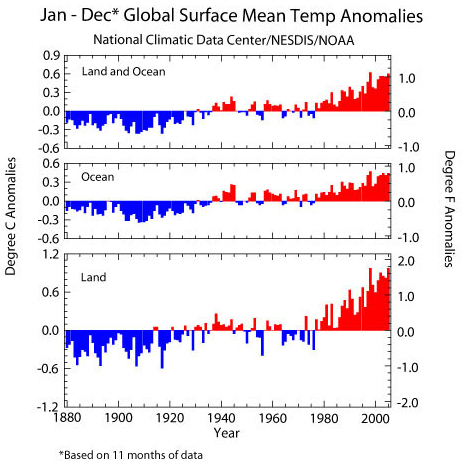 Image courtesy of NOAA. 2005 had worst weather-related economic losses in history 12/06/2005 |
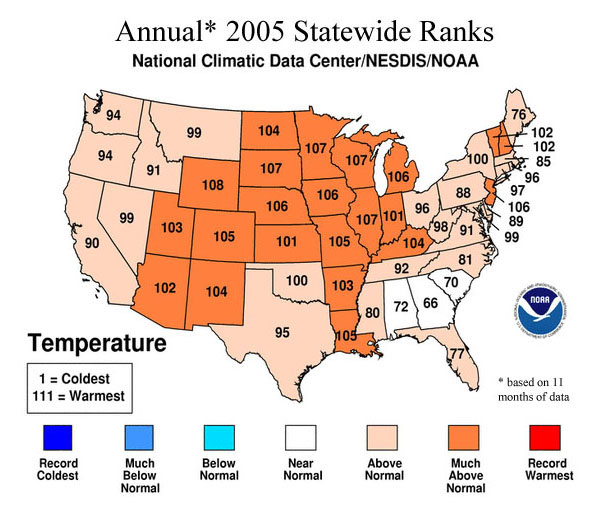
Warmer-than-average 2005 for U.S. NOAA scientists report that the 2005 annual average temperature for the contiguous United States (based on preliminary data) will likely be 1.0 degrees F (0.6 degrees C) above the 1895-2004 mean, which will make 2005 one of the 20 warmest years on record for the country. Mean temperatures through the end of November were warmer than average in all but three states. No state was cooler than average. A July heat wave pushed temperatures soaring beyond 100 degrees, and broke more than 200 daily records established in six western states. A new record of seven consecutive days at — or above — 125 degrees F was established at Death Valley, Calif. The heat wave spread across the country during late July, scorching the East and prompted record electricity usage in New England and New York.
Drought, Rainfall and Snow
The 2004-2005 winter was a season of contrasts for the West, with excessive rainfall in the Southwest and severe drought in the Northwest. A parade of winter Pacific storms triggered severe flooding and devastating landslides in southern California and brought the second-wettest winter on record to the Southwest region. Record and near-record snowpack levels, which were widespread across the Southwest by early spring, eased drought in a region where it had persisted for five years. Meanwhile, drought conditions worsened in the Pacific Northwest and northern Rockies in early 2005 and snowpack in much of the region was at record low levels at the end of winter. However, above average precipitation in subsequent months led to improving drought conditions in much of the region.
During spring, the drought focus shifted to the Midwest and southern Plains. Severe dryness persisted across parts of northern Illinois, with Chicago and Rockford recording their driest March-November on record. Drought disasters were declared in all or parts of Arkansas, Illinois, Iowa, Kansas, Missouri, Texas and Wisconsin. Drier-than-average conditions contributed to an active wildfire season that burned more than 8.5 million acres in 2005 — 4.5 million acres consumed in Alaska alone, based on preliminary data from the National Interagency Fire Center. This exceeds the old record set in 2000 for acreage burned in a wildfire season for the United States as a whole. At the end of November, 18 percent of the contiguous United States was in moderate-to-extreme drought based on a widely used measure of drought (the Palmer Drought Index) in contrast to six percent at the end of November last year.
  Images courtesy of NOAA. |
Record precipitation fell in the Northeast during the fall with three storm systems affecting the region in October. Nine states in the Northeast had their wettest October since 1895, and the October snowfall record on Mount Washington was shattered when 78.9 inches of snow fell during the month. Another notable snow storm in 2005 was the Blizzard of 2005,’ which brought more than two feet of snow across much of southern New England in late January. This storm ranked as the seventh most extreme snow event in the Northeast as measured by a newly developed Northeast Snowfall Impact Scale (NESIS) index and contributed to the snowiest January on record in Boston.
Tropical Cyclones and Hurricanes
The 2005 Atlantic hurricane season set several records. There were 26 named storms (storms with sustained winds of at least 39 miles per hour). In addition, there were an unprecedented 14 hurricanes, of which seven were major hurricanes (Category 3 or better on the Saffir-Simpson Scale). Three category 5 storms (sustained winds of 156 miles per hour or more) formed in the Atlantic Basin for the first time in a single season (Katrina, Rita and Wilma). Four major hurricanes and three tropical storms made landfall in the U.S., with an eighth storm (Ophelia) brushing the North Carolina coast. Tropical cyclone activity was near to below average in the Eastern Pacific and Western North Pacific basins through early December.
Global
The global annual temperature for combined land and ocean surfaces is expected to be very close to the record global temperature that was established in 1998 under the influence of an extremely strong El Niño episode. There has been no such El Niño event in 2005, but rather, unusual warmth across large parts of the globe throughout the year. NOAA is in the process of transitioning to an improved global temperature analysis system. The data analysis system used by NOAA for global temperature analyses over the past eight years indicates that 2005 would likely be the second-warmest year on record (1.06 degrees F; 0.59 degrees C above the 1880-2004 mean), marginally lower than 1998.
The largest temperature anomalies were widespread throughout high latitude regions of the Northern Hemisphere and included much of Russia, Scandinavia, Canada and Alaska. During the past century, global surface temperatures have increased at a rate near 1.1 degrees F/Century (0.6 degrees C/Century), but the rate of temperature increase has been three times larger since 1976, with some of the largest temperature increases occurring in the high latitudes.
 Image courtesy of NOAA. |
Reflecting the global warmth in 2005, a new record was established in September for the lowest Arctic sea ice extent since satellite monitoring began in the late 1970s, according to the National Snow and Ice Data Center. This is part of a continuing trend in end-of-summer Arctic sea ice extent reductions of approximately eight percent per decade since 1979.
The year began with the continuation of a weak El Niño episode that developed in late 2004, but sea surface temperatures in the central and east-central equatorial Pacific decreased early in the year and the episode ended by late February. Few impacts from the weak El Niño occurred worldwide, and neutral conditions persisted for the remainder of the year.
Significant weather and climate events for the globe included: severe drought in parts of southern Africa and the Greater Horn of Africa, extreme monsoon-related rainfall in western India including a 24-hour rainfall total of 37.1 inches in Mumbai, the worst drought in decades in the Amazon River basin, severe drought in large parts of western Europe, and a record warm year in Australia.
NOAA, an agency of the U.S. Department of Commerce, is dedicated to enhancing economic security and national safety through the prediction and research of weather and climate-related events and providing environmental stewardship of the nation’s coastal and marine resources.
Through the emerging Global Earth Observation System of Systems (GEOSS), NOAA is working with its federal partners and nearly 60 countries to develop a global monitoring network that is as integrated as the planet it observes.
WMO STATEMENT ON THE STATUS OF THE GLOBAL CLIMATE IN 2005
World Meteorological Organization (WMO) release
GENEVA, 15 December (WMO)—The global mean surface temperature in 2005 is currently estimated to be +0.48° C above the 1961-1990 annual average (14° C), according to the records maintained by Members of the World Meteorological Organization (WMO). 2005 is currently the second warmest year on record and 2005 is likely to be among the warmest 4 years in the temperature record since 1861, but official figures will not be released until February. The year 1998 remains the warmest year, with optimum averaged surface temperatures averaging +0.54° C above the same 30-year mean. The uncertainty in the global temperature values, arising mainly from gaps in data coverage, are such that 2005 could be the warmest year or the eighth warmest year on record. The last 10 years (1996-2005), with the exception of 1996, are the warmest years on record.
Averaged separately for both hemispheres, 2005 surface temperatures for the northern hemisphere (0.65° C above 30-year mean) are likely to be the warmest and for the southern hemisphere (0.32° C above 30-year mean), the fourth warmest in the instrumental record from 1861 to the present.
Globally, October 2005 was the warmest October on record, surpassing that of last year and June 2005 was the warmest June, surpassing that of 1998. Areas of significant warmth were widespread with large areas of Africa, Australia, Brazil, China and the United States showing significantly above-average temperatures. Much of the North Atlantic and tropical Indian Ocean were also significantly warm, along with the Gulf of Alaska. Sea-surface temperatures in the North Atlantic in 2005 are likely to be the warmest on record.
The large-scale climate phenomenon El Niño can contribute to above-average warmth, as was the case with extremely strong 1997/1998 episode. But the weak El Niño conditions in the equatorial Pacific Ocean that developed in 2004, faded quickly to near-neutral conditions by March 2005 and little impact on global temperatures occurred.
Since the start of the 20th century, the global average surface temperature has risen between 0.6° C and 0.7° C. But this rise has not been continuous. Since 1976, the global average temperature has risen sharply, at 0.18° C per decade. In the northern and southern hemispheres, the 1990s were the warmest decade with an average of 0.38° C and 0.23° C above the 30-year mean, respectively.
Regional temperature anomalies
For Australia, preliminary data indicate that 2005 will be the hottest year since records commenced in 1910, with around 97 per cent of the continent experiencing above-average mean temperatures. During the January-May period, the hottest maximum temperatures on record exacerbated the exceptionally dry conditions. Nationwide temperatures during the first five months of the year were 1.75° C above normal, surpassing the previous record by a substantial
0.57° C. In India, Pakistan and Bangladesh, extremely harsh heat waves in May and June brought maximum temperatures of between 45° C and 50° C. The delayed south-west monsoon rains allowed the heatwave to persist into June, claiming at least 400 lives in India. A severe heatwave gripped the south-western United States from early to mid-July, setting up numerous temperature records. Central Canada experienced its warmest and most humid summer on record. In China, the 2005 summer seasonal temperature was one of the warmest since 1951. Severe heat wave conditions also affected much of southern Europe and North Africa during July. In Algeria, the heatwave in July pushed temperatures as high as 50° C. Extremely cold temperatures affected much of the Balkan region during the first half of February. In Morocco, a cold wave in January dropped temperatures as low as 14° C.
Prolonged drought in some regions
Long-term drought continued in parts of the Greater Horn of Africa, including southern Somalia, eastern Kenya, south-eastern Ethiopia, north-eastern Tanzania and Djibouti. The rainy season (March-June) brought below-normal precipitation over this region. Sporadic rainfall during the 2004/05 rainy season caused serious shortfalls in the cereal harvest in Zimbabwe, Malawi, Angola and Mozambique. At least 5 million people in Malawi were threatened with hunger arising from the worst drought in a decade.
Multi-month drought conditions also affected much of western Europe during July, August and September. During the period October 2004 to June 2005, rainfall was less than half the normal in areas of the United Kingdom, France, Spain and Portugal. In France, western parts were most acutely affected. Neighbouring Spain and Portugal experienced the worst drought conditions since the late 1940s and the dry conditions aggravated wildfires.
The period January to May 2005 was exceptionally dry for much of Australia with 44 per cent of the continent experiencing rainfall in the lowest 10 per cent of the recorded totals. During this period, Australia received an average of only 168 mm of rainfall, the second lowest January – May total since records commenced in 1900.
Across the United States, moderate-to-severe drought persisted throughout parts of the Pacific North-West eastward into the northern Rocky Mountains. At the end of winter, moderate-to-extreme drought affected 72 per cent of the Pacific North-West. Below-normal rainfall since December 2004 caused severe drought conditions over southern parts of Brazil, where corn and soybean crops were severely damaged. In Brazil, the southernmost state of Rio Grande do Sul, which is one of Brazil’s most prolific agricultural states, was the worst affected; the state of Amazonas experienced the worst drought in nearly 60 years, resulting in record low water levels in the Amazon River.
Heavy precipitation and flooding in many other regions
The south-west monsoon during June-September brought unprecedented heavy rain and widespread massive flooding to parts of western and southern India, affecting more than 20 million people and resulting in more than 1800 deaths. On 27 July, Mumbai (Bombay) recorded unprecedented heavy rainfall of 944 mm in the previous 24 hours, which is an all-time 24-hour rainfall record for the city. After a near-normal south-west monsoon, heavy rainfall continued unabated in southern parts of India. The associated devastating floods affected more than 2 million people with at least 200 fatalities. Heavy rains in October caused disastrous flooding also in northern Bangladesh and in Viet Nam. During the third week of June, consecutive heavy rainstorms in parts of southern China killed at least 170 people and affected about 21 million. During early and middle July, heavy rainstorms affected the upper reaches of the Huaihe River Basin.
Persistent heavy rains during the period May-August led to destructive flooding in eastern Europe, particularly in Romania, Bulgaria and Hungary, causing damage to property, infrastructure and agriculture. Torrential rainfall in mid-August also flooded sections of Switzerland, Austria and southern Germany and the Czech Republic. The hardest hit area was Romania where 66 flood-related fatalities and losses of at least US$ 1.9 million in damage were reported. During April and May, floods and landslides were widespread in southern parts of Russia, affecting more than 4000 people.
An onslaught of winter storms in early January brought exceptionally heavy rain, snow and flooding to the south-western United States. Los Angeles (California) had its second wettest rain fall season on record. During January, a major winter snowstorm, affected areas of the north- eastern United States with more than 30 cm of snow accumulation. Record rainfall occurred in the north-east United States in the autumn of 2005, with three storm systems affecting the region in October. Heavy flooding from rain also created huge economic losses across Canada. In June, three major rain events in southern Alberta produced the costliest natural disaster in the province’s history. Across Canada, 2005 was the wettest year on record.
In New Zealand, the Bay of Plenty floods in May were phenomenal with unprecedented heavy rains, which caused widespread damage in parts of Tauranga. Heavy rains affected drought-stricken areas of eastern Australia from mid to late June, producing flooding across south-east Queensland and the far north of New South Wales.
Heavy rains in January and February caused massive flooding in Guyana’s capital, Georgetown, and surrounding areas affecting more than 290 000 people. In February, at least two weeks of heavy rainfall in Colombia and Venezuela caused river flooding and landslides that resulted in the deaths of at least 80 people.
Cold weather and heavy snowfall that began in January continued in February over south-west Asia, causing avalanches. In parts of Tajikistan, two metres of snow accumulated in two weeks. During February, sections of northern Pakistan and neighbouring areas of northern India received heavy snowfall, described as the worst in two decades. In India, at least 230 people died as a result of the extreme winter weather. In Pakistan’s north-west province, 360 deaths in February were attributed to flooding, landslides and avalanches. Heavy rains during March also caused flooding in parts of western Pakistan and Afghanistan, resulting in more than 200 fatalities.
Record number of deadly hurricanes
The 2005 Atlantic Hurricane season brought an unprecedented 26 named tropical storms that caused devastating losses across Central America, the Caribbean and the United States. Fourteen of the named storms were hurricanes. Seven of those were “major” hurricanes (category three or higher on the Saffir-Simpson scale). On average, 10 named storms develop in the Atlantic Basin, six of which are hurricanes. The 2005 hurricane season broke the previous record for the most named storms (21 storms in 1933) and for the most hurricanes (12 in 1969). Since 1995, there has been a marked increase in the annual number of tropical storms in the Atlantic Basin, due to a cyclic pattern. In Central America and the Caribbean region, most damage occurred from Hurricanes Dennis, Emily, Stan, Wilma and Beta. Seven storms including four hurricanes made landfall in the United States. Hurricane Katrina was the deadliest hurricane to affect the United States since 1928. The storm killed at least 1 300 people, mostly in the southern states of Louisiana and Mississippi and produced widespread devastation along the central US Gulf coast. Hurricane Wilma was the most intense Atlantic Hurricane ever recorded.
Conversely, in the eastern North Pacific, activity was below average. Fifteen named storms developed during the year, compared to the average of 16 and there were fewer strong storms. Of those 15 storms, seven reached hurricane strength and two reached “major” status. In the North-west Pacific, 23 named storms developed: the average number is 27. Thirteen of them reached typhoon intensity. Typhoon Talim crossed south-eastern China and caused serious damage, including at least 150 deaths. In early September, typhoon Nabi caused severe damage, and brought a record heavy precipitation of 1 321 mm in three days in western Japan. Typhoon Longwang, which caused flash floods, was responsible for at least 80 deaths in south-east China. Tropical cyclone Ingrid, which lasted from 5 to 16 March, was the first cyclone recorded to reach intensity of Category 5 off three different Australian states (Queensland, Northern Territory, and Western Australia).
Greater ozone depletion in the Antarctic and Arctic
This year, the size of the Antarctic ozone hole was close to 2003 values and well above the 1995-2004 average. The maximum size of the Antarctic ozone hole (24.4 million km2) was reached in the third week of September. The ozone hole in 2005 dissipated earlier than usual, in mid-November. Based on satellite observations, the ozone hole of 2005 ranks as the third largest ever recorded after 2000 and 2003. This year, greater ozone depletion took place in the Arctic. During the spring of 2005, in large portions of the Arctic region, average values of total ozone were 30-45 per cent lower than comparable values during the early 1980s.
Arctic sea-ice decline intensifies
Typically, September is the month with the least sea-ice extent in Arctic. By the end of September 2005, Arctic sea-ice extent dropped far below the average for the fourth consecutive year. It was about 20 per cent less than the 1979-2004 average, the lowest extent ever observed during the satellite record since 1979. Satellite information suggests a general decline of 8 per cent in end-of-September Arctic sea-ice extent over the last two and a half decades. Warmer-than-average Arctic temperatures and an early arrival of the sea-ice melt season are the main causes for the intensification of sea-ice decline in 2005.
Information sources
This preliminary information for 2005 is based on observations up to the end of November from networks of land-based weather stations, ships and buoys. The data are collected and disseminated on a continuing basis by the National Meteorological and Hydrological Services of WMO Member countries.
It should be noted that, following established practice, WMO’s global temperature analyses are based on three different datasets. These include the annual optimally averaged global and hemispheric data series, maintained by the Hadley Centre of the Met Office, UK, from which the official rankings are sourced. The other two data sets are the combined dataset maintained by the Hadley Centre of the Met Office, UK, and the Climatic Research Unit, University of East Anglia, UK, from which the latest values are derived, and a dataset maintained by the USA Department of Commerce’s National Oceanic and Atmospheric Administration (NOAA). Results from these two datasets are comparable.
More extensive, updated information will be made available in the annual WMO statement on the status of the Global Climate in 2005, to be published in early March 2006.
(*A joint Press Release issued in collaboration with the Hadley Centre of the Met Office, UK, the Climatic Research Unit, University of East Anglia, UK and in the USA: NOAA’s National Climatic Data Centre, National Environmental Satellite and Data Information Service and NOAA’s National Weather Service. Other contributors are WMO Member countries: Argentina, Australia, Canada, China, Fiji Islands, France, Germany, India, Japan, Mauritius, Morocco, New Zealand, Norway, and Sweden).