
 Spanish company Ferry Group is to invest €42/US$55.2 million in a project for the production of biomass fuel pellets in Bulgaria.
The 3-year project consists of establishing plantations of paulownia trees near the city of Tran. Paulownia is a fast-growing tree used for the commercial production of fuel pellets.
Spanish company Ferry Group is to invest €42/US$55.2 million in a project for the production of biomass fuel pellets in Bulgaria.
The 3-year project consists of establishing plantations of paulownia trees near the city of Tran. Paulownia is a fast-growing tree used for the commercial production of fuel pellets.

IPCC Fourth Assessment Report: climate change 'very likely' caused by humans
 After intense reviews of the final text, the Intergovernmental Panel on Climate Change (IPCC) which convened in Paris, released its long awaited first volume of the Climate Change 2007 report, also known as the Fourth Assessment Report (AR4).
This first part, The Physical Science Basis, produced by Working Group I of the IPCC, calls global warming 'unequivocal', with most of the observed increases in globally averaged temperatures since the mid-20th century being 'very likely' due to the increase in greenhouse gas concentrations caused by anthropogenic emissions. The term 'very likely' indicates that expert judgement considers that (the causes of) an observed outcome can be pinpointed correctly with a probability greater than 90%. Continued greenhouse gas emissions at or above current rates will cause further warming and induce many changes in the global climate that will also 'very likely' be larger than those observed during the 20th century. In the IPCC's previous, Third Assessment Report 2001 (TAR), the role of anthropogenic emissions was merely deemed the 'likely' cause of global warming — a term indicating a probability greater than 66%.
The entire Climate Change 2007 report is written by diferent working groups and will comprise three main volumes:
- Working Group I: The Physical Science Basis (Release 2 February 2007)
- Working Group II: Impacts, Adaptation and Vulnerability (Acceptance and approval 2-5 April 2007)
- Working Group III: Mitigation of Climate Change (Acceptance and approval 30 April - 3 May 2007)
- A short 30-page synthesis report
The document released today is the Summary [*.pdf] of that work, which includes the following findings and projections based on different greenhouse gas emissions scenarios:
 biomass :: bioenergy :: biofuels :: energy :: sustainability :: climate change :: global warming :: greenhouse gas emissions :: IPCC ::
 The IPCC uses the following terminology to indicate the probability of the occurrence of a result, an outcome, a cause, an event or a projection thereof:
virtually certain - more than 99%
extremely likely - more than 95%
very likely - more than 90%
likely - more than 60%
more likely than not - more than 50%
unlikely - less than 33%
very unlikely - less than 10%
extremely unlikely - less than 5%
HUMAN AND NATURAL DRIVERS OF CLIMATE CHANGE
Changes in the atmospheric abundance of greenhouse gases and aerosols, in solar radiation and in land surface properties alter the energy balance of the climate system. These changes are expressed in terms of radiative forcing, which is used to compare how a range of human and natural factors drive warming or cooling influences on global climate. Since the Third Assessment Report (TAR), new observations and related modelling of greenhouse gases, solar activity, land surface properties and some aspects of aerosols have led to improvements in the quantitative estimates of radiative forcing.
Greenhouse gas emissions
Global atmospheric concentrations of carbon dioxide, methane and nitrous oxide have increased markedly as a result of human activities since 1750 and now far exceed pre-industrial values determined from ice cores spanning many thousands of years. The global increases in carbon dioxide concentration are due primarily to fossil fuel use and land-use change, while those of methane and nitrous oxide are primarily due to agriculture.
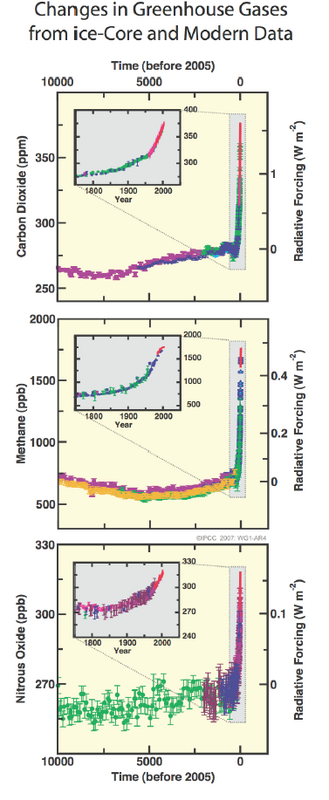 FIGURE SPM-1 (click to enlarge). Atmospheric concentrations of carbon dioxide, methane and nitrous oxide over the last 10,000 years (large panels) and since 1750 (inset panels). Measurements are shown from ice cores (symbols with different colours for different studies) and atmospheric samples (red lines). The corresponding radiative forcings are shown on the right hand axes of the large panels.
Carbon dioxide
Carbon dioxide is the most important anthropogenic greenhouse gas. The global atmospheric concentration of carbon dioxide has increased from a pre-industrial value of about 280 ppm to 379 ppm3 in 2005. The atmospheric concentration of carbon dioxide in 2005 exceeds by far the natural range over the last 650,000 years (180 to 300 ppm) as determined from ice cores. The annual carbon dioxide concentration growth-rate was larger during the last 10 years (1995 – 2005 average: 1.9 ppm per year), than it has been since the beginning of continuous direct atmospheric measurements (1960–2005 average: 1.4 ppm per year) although there is year-to-year variability in growth rates.
The primary source of the increased atmospheric concentration of carbon dioxide since the pre-industrial period results from fossil fuel use, with land use change providing another significant but smaller contribution. Annual fossil carbon dioxide emissions increased from an average of 6.4 [6.0 to 6.8] 5 GtC, (23.5 [22.0 to 25.0] GtCO2) per year in the 1990s, to 7.2 [6.9 to 7.5] GtC (26.4 [25.3 to 27.5] GtCO2) per year in 2000–2005 (2004 and 2005 data are interim estimates). Carbon dioxide emissions associated with land-use change are estimated to be 1.6 [0.5 to 2.7] GtC (5.9 [1.8 to 9.9] GtCO2) per year over the 1990s, although these estimates have a large uncertainty. {2.3, 7.3}
Methane
The global atmospheric concentration of methane has increased from a pre-industrial value of about 715 ppb to 1732 ppb in the early 1990s, and is 1774 ppb in 2005. The atmospheric concentration of methane in 2005 exceeds by far the natural range of the last 650,000 years (320 to 790 ppb) as determined from ice cores. Growth rates have declined since the early 1990s, consistent with total emissions (sum of anthropogenic and natural sources) being nearly constant during this period. It is very likely that the observed increase in methane concentration is due to anthropogenic activities, predominantly agriculture and fossil fuel use, but relative contributions from different source types are not well determined.
Nitrous oxide
The global atmospheric nitrous oxide concentration increased from a pre-industrial value of about 270 ppb to 319 ppb in 2005. The growth rate has been approximately constant since 1980. More than a third of all nitrous oxide emissions are anthropogenic and are primarily due to agriculture.
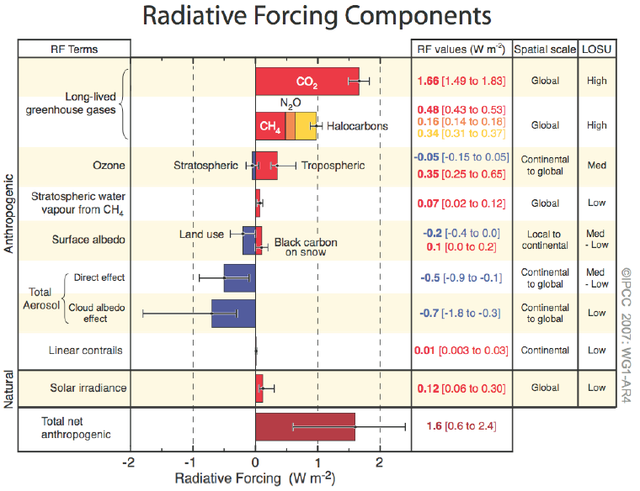 FIGURE SPM-2 (click to enlarge). Global-average radiative forcing (RF) estimates and ranges in 2005 for anthropogenic carbon dioxide (CO2), methane (CH4), nitrous oxide (N2O) and other important agents and mechanisms, together with the typical geographical extent (spatial scale) of the forcing and the assessed level of scientific understanding (LOSU). The net anthropogenic radiative forcing and its range are also shown. These require summing asymmetric uncertainty estimates from the component terms, and cannot be obtained by simple addition. Additional forcing factors not included here are considered to have a very low LOSU. Volcanic aerosols contribute an additional natural forcing but are not included in this figure due to their episodic nature. Range for linear contrails does not include other possible effects of aviation on cloudiness.
Warming of the climate system
The understanding of anthropogenic warming and cooling influences on climate has improved since the Third Assessment Report (TAR), leading to very high confidence that the globally averaged net effect of human activities since 1750 has been one of warming, with a radiative forcing of +1.6 [+0.6 to +2.4] W m-2.
Effect of greenhouse gas emissions
The combined radiative forcing due to increases in carbon dioxide, methane, and nitrous oxide is +2.30 [+2.07 to +2.53] W m-2, and its rate of increase during the industrial era is very likely to have been unprecedented in more than 10,000 years. The carbon dioxide radiative forcing increased by 20% from 1995 to 2005, the largest change for any decade in at least the last 200 years.
Effect of anthropogenic aerosols
Anthropogenic contributions to aerosols (primarily sulphate, organic carbon, black carbon, nitrate and dust) together produce a cooling effect, with a total direct radiative forcing of -0.5 [-0.9 to -0.1] W m-2 and an indirect cloud albedo forcing of -0.7 [-1.8 to -0.3] W m-2. These forcings are now better understood than at the time of the TAR due to improved in situ, satellite and ground-based measurements and more comprehensive modelling, but remain the dominant uncertainty in radiative forcing. Aerosols also influence cloud lifetime and precipitation.
Effect of other antropogenic sources
Significant anthropogenic contributions to radiative forcing come from several other sources. Tropospheric ozone changes due to emissions of ozone-forming chemicals (nitrogen oxides, carbon monoxide, and hydrocarbons) contribute +0.35 [+0.25 to +0.65] W m-2. The direct radiative forcing due to changes in halocarbons is +0.34 [+0.31 to +0.37] W m-2. Changes in surface albedo, due to land-cover changes and deposition of black carbon aerosols on snow, exert respective forcings of -0.2 [-0.4 to 0.0] and +0.1 [0.0 to +0.2] W m-2.
Effect of changes in solar irradiance
Changes in solar irradiance since 1750 are estimated to cause a radiative forcing of +0.12 [+0.06 to +0.30] W m-2, which is less than half the estimate given in the TAR.
DIRECT OBSERVATIONS OF RECENT CLIMATE CHANGE
Since the TAR, progress in understanding how climate is changing in space and in time has been gained through improvements and extensions of numerous datasets and data analyses, broader geographical coverage, better understanding of uncertainties, and a wider variety of measurements. Increasingly comprehensive observations are available for glaciers and snow cover since the 1960s, and for sea level and ice sheets since about the past decade. However, data coverage remains limited in some regions.
Warming of the climate system
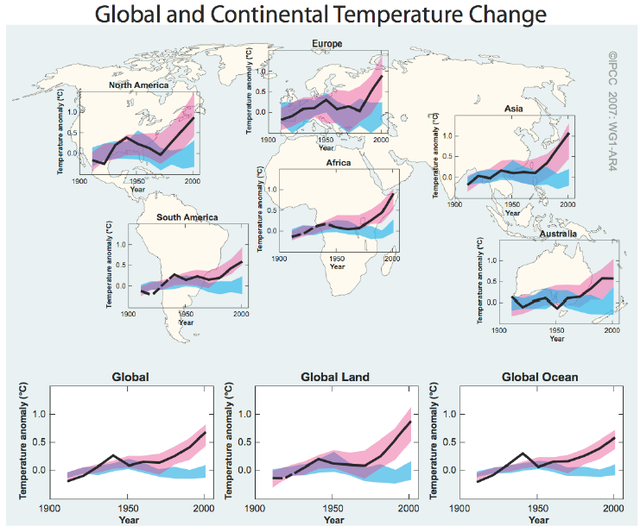
Warming of the climate system is unequivocal, as is now evident from observations of increases in global average air and ocean temperatures, widespread melting of snow and ice, and rising global mean sea level.
Surface temperatures
Eleven of the last twelve years (1995 -2006) rank among the 12 warmest years in the instrumental record of global surface temperature (since 1850). The updated 100-year linear trend (1906–2005) of 0.74 [0.56 to 0.92]°C is therefore larger than the corresponding trend for 1901-2000 given in the TAR of 0.6 [0.4 to 0.8]°C. The linear warming trend over the last 50 years (0.13 [0.10 to 0.16]°C per decade) is nearly twice that for the last 100 years. The total temperature increase from 1850 – 1899 to 2001 – 2005 is 0.76 [0.57 to 0.95]°C. Urban heat island effects are real but local, and have a negligible influence (less than 0.006°C per decade over land and zero over the oceans) on these values.
Atmospheric temperatures
New analyses of balloon-borne and satellite measurements of lower- and mid-tropospheric temperature show warming rates that are similar to those of the surface temperature record and are consistent within their respective uncertainties, largely reconciling a discrepancy noted in the TAR.
Atmospheric water vapor
The average atmospheric water vapour content has increased since at least the 1980s over land and ocean as well as in the upper troposphere. The increase is broadly consistent with the extra water vapour that warmer air can hold.
Ocean temperatures
Observations since 1961 show that the average temperature of the global ocean has increased to depths of at least 3000 m and that the ocean has been absorbing more than 80% of the heat added to the climate system. Such warming causes seawater to expand, contributing to sea level rise.
Glaciers and snow cover
Mountain glaciers and snow cover have declined on average in both hemispheres. Widespread decreases in glaciers and ice caps have contributed to sea level rise (ice caps do not include contributions from the Greenland and Antarctic ice sheets).
Arctic and Antarctic ice sheets
New data since the TAR now show that losses from the ice sheets of Greenland and Antarctica have very likely contributed to sea level rise over 1993 to 2003. Flow speed has increased for some Greenland and Antarctic outlet glaciers, which drain ice from the interior of the ice sheets. The corresponding increased ice sheet mass loss has often followed thinning, reduction or loss of ice shelves or loss of floating glacier tongues. Such dynamical ice loss is sufficient to explain most of the Antarctic net mass loss and approximately half of the Greenland net mass loss. The remainder of the ice loss from Greenland has occurred because losses due to melting have exceeded accumulation due to snowfall.
Sea levels
Global average sea level rose at an average rate of 1.8 [1.3 to 2.3] mm per year over 1961 to 2003. The rate was faster over 1993 to 2003, about 3.1 [2.4 to 3.8] mm per year. Whether the faster rate for 1993 to 2003 reflects decadal variability or an increase in the longer-term trend is unclear. There is high confidence that the rate of observed sea level rise increased from the 19th to the 20th century. The total 20th century rise is estimated to be 0.17 [0.12 to 0.22] m.
Observations of climate contributions to sea level rise
For 1993-2003, the sum of the climate contributions is consistent within uncertainties with the total sea level rise that is directly observed. These estimates are based on improved satellite and in-situ data now available. For the period of 1961 to 2003, the sum of climate contributions is estimated to be smaller than the observed sea level rise. The TAR reported a similar discrepancy for 1910 to 1990.
Other long-term changes in climate
At continental, regional, and ocean basin scales, numerous long-term changes in climate have been observed. These include changes in Arctic temperatures and ice, widespread changes in precipitation amounts, ocean salinity, wind patterns and aspects of extreme weather including droughts, heavy precipitation, heat waves and the intensity of tropical cyclones. Some aspects of climate have not been observed to change.
Arctic temperatures
Average Arctic temperatures increased at almost twice the global average rate in the past 100 years. Arctic temperatures have high decadal variability, and a warm period was also observed from 1925 to 1945.
Arctic sea ice extent
Satellite data since 1978 show that annual average Arctic sea ice extent has shrunk by 2.7 [2.1 to 3.3]% per decade, with larger decreases in summer of 7.4 [5.0 to 9.8]% per decade. These values are consistent with those reported in the TAR.
Permafrost
Temperatures at the top of the permafrost layer have generally increased since the 1980s in the Arctic (by up to 3°C). The maximum area covered by seasonally frozen ground has decreased by about 7% in the Northern Hemisphere since 1900, with a decrease in spring of up to 15%.
Changes in precipitation
Long-term trends from 1900 to 2005 have been observed in precipitation amount over many large regions. Significantly increased precipitation has been observed in eastern parts of North and South America, northern Europe and northern and central Asia. Drying has been observed in the Sahel, the Mediterranean, southern Africa and parts of southern Asia. Precipitation is highly variable spatially and temporally, and data are limited in some regions. Long-term trends have not been observed for the other large regions assessed.
Precipitation over oceans
Changes in precipitation and evaporation over the oceans are suggested by freshening of mid and high latitude waters together with increased salinity in low latitude waters.
Mid-latitude westerlies
Mid-latitude westerly winds have strengthened in both hemispheres since the 1960s.
Droughts
More intense and longer droughts have been observed over wider areas since the 1970s, particularly in the tropics and subtropics. Increased drying linked with higher temperatures and decreased precipitation have contributed to changes in drought. Changes in sea surface temperatures (SST), wind patterns, and decreased snowpack and snow cover have also been linked to droughts.
Heavy precipitation events
The frequency of heavy precipitation events has increased over most land areas, consistent with warming and observed increases of atmospheric water vapour.
Extreme temperatures
Widespread changes in extreme temperatures have been observed over the last 50 years. Cold days, cold nights and frost have become less frequent, while hot days, hot nights, and heat waves have become more frequent.
Tropical cyclones
There is observational evidence for an increase of intense tropical cyclone activity in the North Atlantic since about 1970, correlated with increases of tropical sea surface temperatures. There are also suggestions of increased intense tropical cyclone activity in some other regions where concerns over data quality are greater. Multi-decadal variability and the quality of the tropical cyclone records prior to routine satellite observations in about 1970 complicate the detection of long-term trends in tropical cyclone activity. There is no clear trend in the annual numbers of tropical cyclones.
PROJECTIONS OF FUTURE CHANGES IN CLIMATE
A major advance of this assessment of climate change projections compared with the TAR is the large number of simulations available from a broader range of models. Taken together with additional information from observations, these provide a quantitative basis for estimating likelihoods for many aspects of future climate change. Model simulations cover a range of possible futures including idealised emission or concentration assumptions. These include SRES illustrative marker scenarios for the 2000–2100 period and model experiments with greenhouse gases and aerosol concentrations held constant after year 2000 or 2100.
The Emission Scenarios of the IPCC Special Report on Emission Scenarios (SRES)
A1. The A1 storyline and scenario family describes a future world of very rapid economic growth, global population that peaks in mid-century and declines thereafter, and the rapid introduction of new and more efficient technologies. Major underlying themes are convergence among regions, capacity building and increased cultural and social interactions, with a substantial reduction in regional differences in per capita income. The A1 scenario family develops into three groups that describe alternative directions of technological change in the energy system. The three A1 groups are distinguished by their technological emphasis: fossil intensive (A1FI), non-fossil energy sources (A1T), or a balance across all sources (A1B) (where balanced is defined as not relying too heavily on one particular energy source, on the assumption that similar improvement rates apply to all energy supply and end use technologies).
A2. The A2 storyline and scenario family describes a very heterogeneous world. The underlying theme is self reliance and preservation of local identities. Fertility patterns across regions converge very slowly, which results in continuously increasing population. Economic development is primarily regionally oriented and per capita economic growth and technological change more fragmented and slower than other storylines.
B1. The B1 storyline and scenario family describes a convergent world with the same global population, that peaks in mid-century and declines thereafter, as in the A1 storyline, but with rapid change in economic structures toward a service and information economy, with reductions in material intensity and the introduction of clean and resource efficient technologies. The emphasis is on global solutions to economic, social and environmental sustainability, including improved equity, but without additional climate initiatives.
B2. The B2 storyline and scenario family describes a world in which the emphasis is on local solutions to economic, social and environmental sustainability. It is a world with continuously increasing global population, at a rate lower than A2, intermediate levels of economic development, and less rapid and more diverse technological change than in the B1 and A1 storylines. While the scenario is also oriented towards environmental protection and social equity, it focuses on local and regional levels.
An illustrative scenario was chosen for each of the six scenario groups A1B, A1FI, A1T, A2, B1 and B2. All should be considered equally sound.
The SRES scenarios do not include additional climate initiatives, which means that no scenarios are included that explicitly assume implementation of the United Nations Framework Convention on Climate Change or the emissions targets of the Kyoto Protocol.
Warming over the next two decades
For the next two decades a warming of about 0.2°C per decade is projected for a range of SRES emission scenarios. Even if the concentrations of all greenhouse gases and aerosols had been kept constant at year 2000 levels, a further warming of about 0.1°C per decade would be expected.
Since IPCC’s first report in 1990, assessed projections have suggested global averaged temperature increases between about 0.15 and 0.3°C per decade for 1990 to 2005. This can now be compared with observed values of about 0.2°C per decade, strengthening confidence in near-term projections.
Model experiments show that even if all radiative forcing agents are held constant at year 2000 levels, a further warming trend would occur in the next two decades at a rate of about 0.1°C per decade, due mainly to the slow response of the oceans. About twice as much warming (0.2°C per decade) would be expected if emissions are within the range of the SRES scenarios. Best-estimate projections from models indicate that decadal-average warming over each inhabited continent by 2030 is insensitive to the choice among SRES scenarios and is very likely to be at least twice as large as the corresponding model-estimated natural variability during the 20th century.
Effects of continued GHG emissions during the 21st century
Continued greenhouse gas emissions at or above current rates would cause further warming and induce many changes in the global climate system during the 21st century that would very likely be larger than those observed during the 20th century.
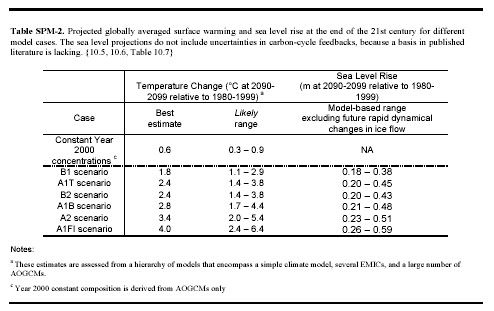 Advances in climate change modelling now enable best estimates and likely assessed uncertainty ranges to be given for projected warming for different emission scenarios. Results for different emission scenarios are provided explicitly in this report to avoid loss of this policy-relevant information. Projected globally averaged surface warmings for the end of the 21st century (2090–2099) relative to 1980–1999 are shown in Table SPM-2 (click to enlarge). These illustrate the differences between lower to higher SRES emission scenarios and the projected warming uncertainty associated with these scenarios.
Best estimates and likely ranges for globally average surface air warming for six SRES emissions marker scenarios are given in this assessment and are shown in Table SPM-2. For example, the best estimate for the low scenario (B1) is 1.8°C (likely range is 1.1°C to 2.9°C), and the best estimate for the high scenario (A1FI) is 4.0°C (likely range is 2.4°C to 6.4°C). Although these projections are broadly consistent with the span quoted in the TAR (1.4 to 5.8°C), they are not directly comparable. The AR4 is more advanced as it provides best estimates and an assessed likelihood range for each of the marker scenarios.
The new assessment of the likely ranges now relies on a larger number of climate models of increasing complexity and realism, as well as new information regarding the nature of feedbacks from the carbon cycle and constraints on climate response from observations.
Warming tends to reduce land and ocean uptake of atmospheric carbon dioxide, increasing the fraction of anthropogenic emissions that remains in the atmosphere. For the A2 scenario, for example, the climate carbon cycle feedback increases the corresponding global average warming at 2100 by more than 1°C. Assessed upper ranges for temperature projections are larger than in the TAR (see Table SPM-2) mainly because the broader range of models now available suggests stronger climate-carbon cyclefeed backs.
Model-based projections of global average sea level rise at the end of the 21st century (2090-2099) are shown in Table SPM-2. For each scenario, the midpoint of the range in Table SPM-2 is within 10% of the TAR model average for 2090-2099. The ranges are narrower than in the TAR mainly because of improved information about some uncertainties in the projected contributions.
Models used to date do not include uncertainties in climate-carbon cycle feedback nor do they include the full effects of changes in ice sheet flow, because a basis in published literature is lacking. The projections include a contribution due to increased ice flow from Greenland and Antarctica at the rates observed for 1993-2003, but these flow rates could increase or decrease in the future. For example, if this contribution were to grow linearly with global average temperature change, the upper ranges of sea level rise for SRES scenarios shown in Table SPM-2 would increase by 0.1 m to 0.2 m. Larger values cannot be excluded, but understanding of these effects is too limited to assess their likelihood or provide a best estimate or an upper
bound for sea level rise.
Increasing atmospheric carbon dioxide concentrations lead to increasing acidification of the ocean. Projections based on SRES scenarios give reductions in average global surface ocean pH17 of between 0.14 and 0.35 units over the 21st century, adding to the present decrease of 0.1 units since pre-industrial times.
There is now higher confidence in projected patterns of warming and other regional-scale features, including changes in wind patterns, precipitation, and some aspects of extremes and of ice.
Projected warming in the 21st century shows scenario-independent geographical patterns similar to those observed over the past several decades. Warming is expected to be greatest over land and at most high northern latitudes, and least over the Southern Ocean and parts of the North Atlantic ocean (see Figure SPM-5).
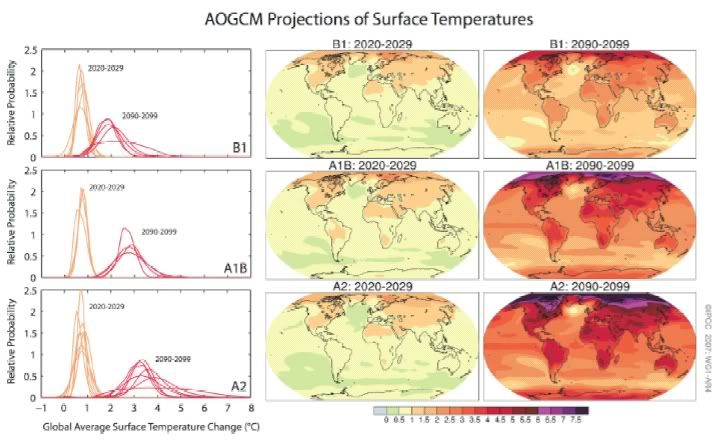 FIGURE SPM-5 (click to enlarge). Projected surface temperature changes for the early and late 21st century relative to the period 1980–1999. The central and right panels show the Atmosphere-Ocean General Circulation multi-Model average projections for the B1 (top), A1B (middle) and A2 (bottom) SRES scenarios averaged over decades 2020–2029 (center) and 2090–2099 (right). The left panel shows corresponding uncertainties as the relative probabilities of estimated global average warming from several different AOGCM and EMICs studies for the same periods. Some studies present results only for a subset of the SRES scenarios, or for various model versions. Therefore the difference in the number of curves, shown in the left-hand panels, is due only to differences in the availability of results.
Snow cover is projected to contract. Widespread increases in thaw depth are projected over most permafrost regions.
Sea ice is projected to shrink in both the Arctic and Antarctic under all SRES scenarios. In some projections, Arctic late-summer sea ice disappears almost entirely by the latter part of the 21st century.
It is very likely that hot extremes, heat waves, and heavy precipitation events will continue to become more frequent.
Based on a range of models, it is likely that future tropical cyclones (typhoons and hurricanes) will become more intense, with larger peak wind speeds and more heavy precipitation associated with ongoing increases of tropical SSTs. There is less confidence in projections of a global decrease in numbers of tropical cyclones. The apparent increase in the proportion of very intense storms since 1970 in some regions is much larger than simulated by current models for that period.
Extra-tropical storm tracks are projected to move poleward, with consequent changes in wind, precipitation, and temperature patterns, continuing the broad pattern of observed trends over the last half-century.
Since the TAR there is an improving understanding of projected patterns of precipitation. Increases in the amount of precipitation are very likely in high-latitudes, while decreases are likely in most subtropical land regions (by as much as about 20% in the A1B scenario in 2100, see Figure SPM-6), continuing observed patterns in recent trends.
Based on current model simulations, it is very likely that the meridional overturning circulation (MOC) of the Atlantic Ocean will slow down during the 21st century. The multi-model average reduction by 2100 is 25% (range from zero to about 50%) for SRES emission scenario A1B. Temperatures in the Atlantic region are projected to increase despite such changes due to the much larger warming associated with projected increases of greenhouse gases. It is very unlikely that the MOC will undergo a large abrupt transition during the 21st century. Longer-term changes in the MOC cannot be assessed with confidence.
Anthropogenic warming and sea level rise would continue for centuries due to the timescales associated with climate processes and feedbacks, even if greenhouse gas concentrations were to be stabilized.
Climate-carbon cycle coupling is expected to add carbon dioxide to the atmosphere as the climate system warms, but the magnitude of this feedback is uncertain. This increases the uncertainty in the trajectory of carbon dioxide emissions required to achieve a particular stabilisation level of atmospheric carbon dioxide concentration. Based on current understanding of climate carbon cycle feedback, model studies suggest that to stabilise at 450 ppm carbon dioxide, could require that cumulative emissions over the 21st century be reduced from an average of approximately 670 [630 to 710] GtC to approximately 490 [375 to 600] GtC. Similarly, to stabilise at 1000 ppm this feedback could require that cumulative emissions be reduced from a model average of approximately 1415 [1340 to 1490] GtC to approximately 1100 [980 to 1250] GtC.
If radiative forcing were to be stabilized in 2100 at B1 or A1B levels a further increase in global mean temperature of about 0.5°C would still be expected, mostly by 2200.
If radiative forcing were to be stabilized in 2100 at A1B levels11, thermal expansion alone would lead to 0.3 to 0.8 m of sea level rise by 2300 (relative to 1980–1999). Thermal expansion would continue for many centuries, due to the time required to transport heat into the deep ocean.
Contraction of the Greenland ice sheet is projected to continue to contribute to sea level rise after 2100. Current models suggest ice mass losses increase with temperature more rapidly than gains due to precipitation and that the surface mass balance becomes negative at a global average warming (relative to pre-industrial values) in excess of 1.9 to 4.6°C. If a negative surface mass balance were sustained for millennia, that would lead to virtually complete elimination of the Greenland ice sheet and a resulting contribution to sea level rise of about 7 m. The corresponding future temperatures in Greenland are comparable to those inferred for the last interglacial period 125,000 years ago, when paleoclimatic information suggests reductions of polar land ice extent and 4 to 6 m of sea level rise.
Dynamical processes related to ice flow not included in current models but suggested by recent observations could increase the vulnerability of the ice sheets to warming, increasing future sea level rise. Understanding of these processes is limited and there is no consensus on their magnitude.
Current global model studies project that the Antarctic ice sheet will remain too cold for widespread surface melting and is expected to gain in mass due to increased snowfall. However, net loss of ice mass could occur if dynamical ice discharge dominates the ice sheet mass balance.
Both past and future anthropogenic carbon dioxide emissions will continue to contribute to warming and sea level rise for more than a millennium, due to the timescales required for removal of this gas from the atmosphere.
Working Group I
The report was produced by Working Group I which consists of some 600 authors from 40 countries. More than 620 expert reviewers and a large number of government reviewers also participated. Approximately 300 delegates from 113 countries reviewed and revised the Summary line-by-line during the course of this past week in Paris, before adopting it and accepting the underlying report. Acceptance is through consensus; the implications is that whatever is accepted and approved has the acceptance of all the participating governments.
More information:
Intergovernmental Panel on Climate Change: Climate Change 2007: The Physical Science Basis. Summary for Policymakers. [*.pdf] - Paris, Feb. 2, 2007.


0 Comments:
Post a Comment
Links to this post:
Create a Link
<< Home